An Enigma


The past week was again a case of the ‘usual’ persisting – not unaided, of course, and more often than not requiring a good deal of ‘assistance’, else important trends could have changed, while other did change, as directed. The yield on the 10-year US Treasury note reversed direction quite steeply, to retreat from the break above 1.7% and settle a bit lower by Friday. The dollar index is fluctuating, but it had lost ground against the euro and the yen last week as if getting ready to swoon a little. Wall Street has become an enigma, raising a number of questions that are not easy to untangle. For gold and silver the month of September is at last starting to live up to its reputation as the best performing month for the metals. The only question is whether this year the metals will be able to fully realise their potential during this final week of September that remains.
The Wall Street enigma really lifted its head on Tuesday, 20th September. That day was a tough one for the forces entrusted wit the job of keeping the DJIA above 18 000. As so often happens recently, the DJIA futures turned bullish during the day to begin active market trading with a steep jump. As also happens quite often, the big jump soon ran out of steam and the trend turned down.
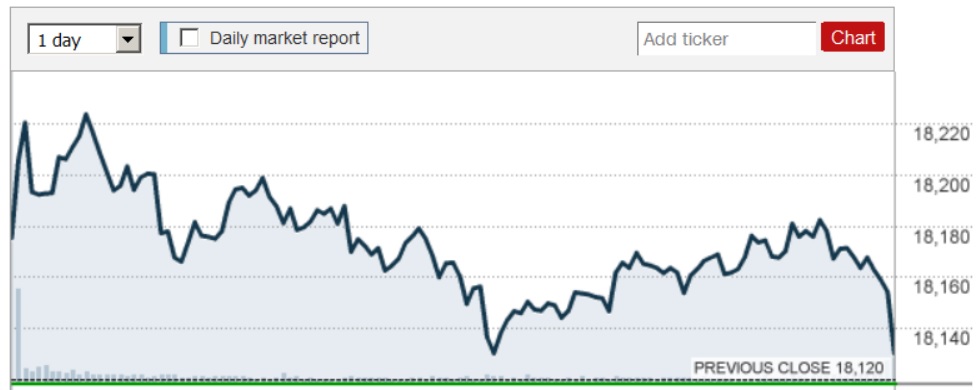
Frequent attempts to reset a rising trend at first failed, as happens often enough for it to appear a habit – until a major rising and still volatile trend is established. This time, though, the finish surprised. Rather than a quiet fizzle, even if the rising trend is not fully maintained, the DJIA turned steeply down, to lose about 30 points in the final few minutes of trading to end at 18130, just 10 points up on the day.
About 8-10 years ago, prior to the financial crisis, the daily turnover in the 30 DJIA stocks averaged about 250-350 million per day. On triple witch days, volume rarely fell below about 600 million shares, on occasion well over 700 million. On Tuesday, the average of the daily turnover for the past three months was 92.5 million while the turnover for the day was a paltry 37.6 million shares.
It is clear that Tuesday saw what, by all evidence, was a really epic battle between the bulls and bears. A tight tussle right to the bitter end at the last minute, with the bears not winning the war, but at least the final confrontation. Yet, the statistics tell a completely different story, the right opposite, in fact.
One reads of computers used for HF trading being position as close to shoulder to shoulder with the NYSE computers to cut transmissions times for the minutest of edges over the competition and performing millions of trades a second. And then on Tuesday we had a daily total of only 37 million (completed) trades, not even one-third of the recent average turnover. On what appears to have been a busy day.
A true conspiracy theorist would immediately think that this proves there is nobody doing any trading on Wall Street (or at least the Dow 30) as an active investor or a trader. It is only, like Father Christmas, the Tooth Fairy and the Devil, someone who is responsible for you and tries hard to keep you happy, healthy and obedient. This explanation seems so enticing, because it fits what is known and, more importantly, if there is a rational cause for the low turnover, it has to be because the investment and trading community has abandoned interest in Wall Street. That in turn can only be because they perceive it to be a rigged market. Or they have no funds to invest.
Whatever explains this enigma, it cannot be good news.
Euro-Dollar
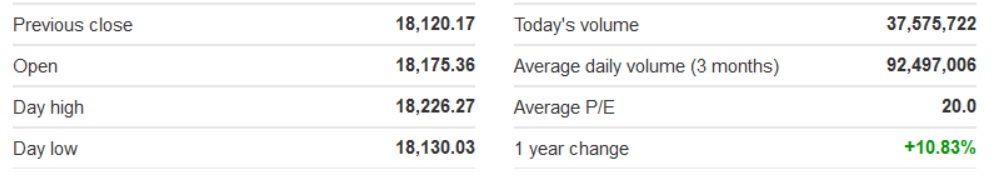
Euro-Dollar, last = $1.1226 (www.investing.com )
The sideways trend between support at line L ($1.1069) and descending resistance at the top of channel UV ($1.1153) has become the ‘as usual’ for the euro. With an absence of significant events that could sway one currency in favour to another, or one financial system over all others, the world has entered a period of ‘sameness’ in which all currencies are devalued at about the same rate and all national economies are boosted by similar amounts of printing.
There is little technical room for the euro to move further sideways before lines V and L will cross, perhaps to force a new trend. Perhaps this provides the timing of an event that will introduce something new into the currently balanced expectations for two of the main global currencies.
DJIA
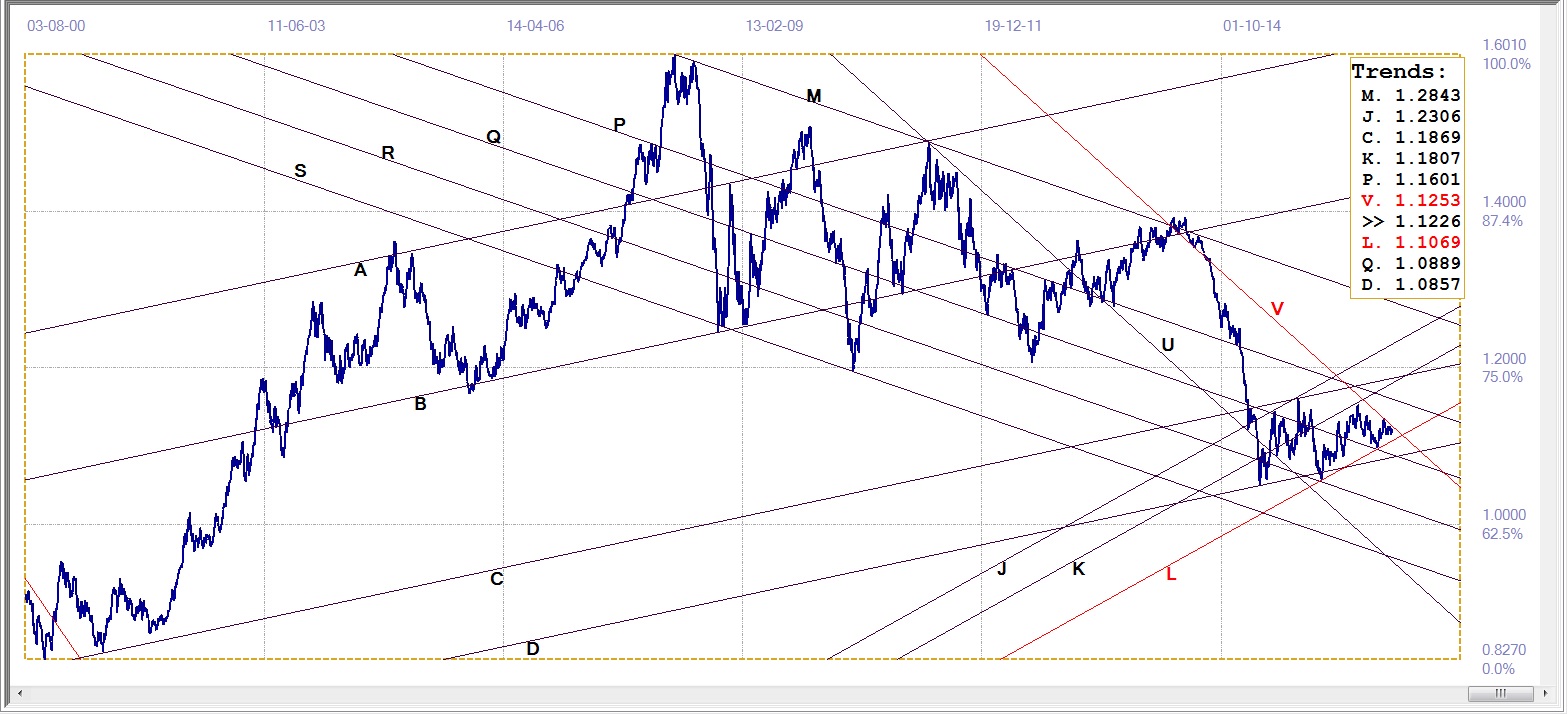
DJIA, last = 18261.45 (money.cnn.com)
The steep move lower that followed the close double top along line A (18 657) did not extend, as was anticipated, given the behaviour of the DJIA after steep falls. Line V (18423) is new, as possible resistance for the new rebound after the recent small sell-off. Shallower bull channels than JKL (19133) can also be constructed in order to contain recent history, but as yet none of these are very convincing.
This may change as the chart develops further, in which case the analysis too will be changed. For the time being the outlook for the DJIA after the break from steep bull channel JKL is bearish – as long as the resistance along line A remains intact, or the bear is confirmed by a break below either of lines P (17785) or Y (17548).
Gold PM Fix - Dollars
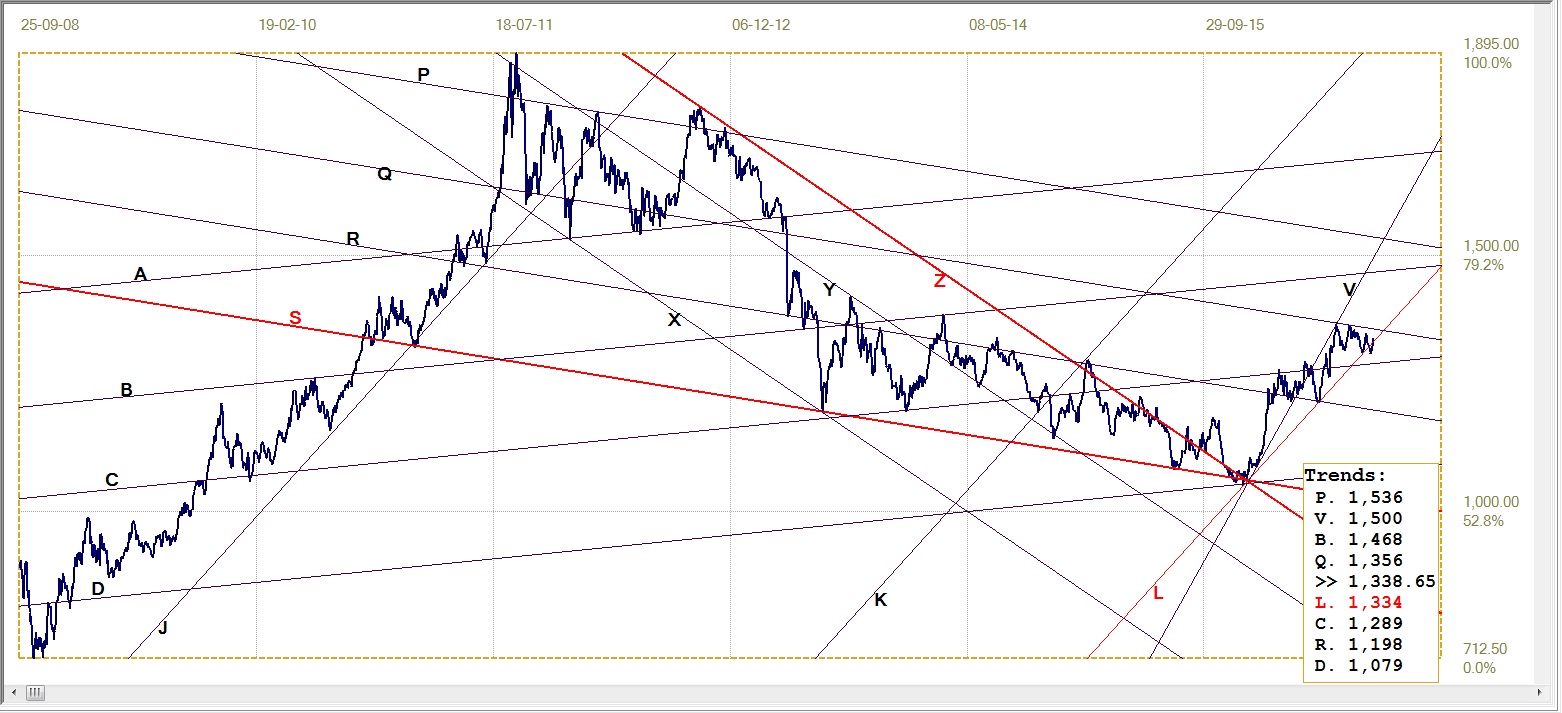
Gold Price – London PM fix, last = $1338.65 (www.kitco.com )
A week ago, the Friday PM fix of $1308.35 broke marginally below bull channel KL (then at $1327) as an early sign of weakness. Since then, after forming the small near term double bottom, gold has rebounded higher and it managed to break just back into channel KL ($1334). If this week can begin with a PM fix above $1334, the value of line L for this Monday, and manage to remain above this support, it will go some way to alleviate concern among gold bulls – more so if the metal can get a clean break above resistance at line Q ($13.56) and the psychological $1350.
Gold PM fix – Euro-Gold
After finding and then rebounding higher off support at the bottom of bull channel KL (€1171), the euro price of gold has again broken above the resistance at line W (€1177) to again look more bullish. The euro price has crept higher slowly, getting closer to the psychological €1200 level. A break higher above this key level will also cast gold into the sights of European investors – and other who pay attention to the price in euro. The Arabs and Russians come to mind in this respect.
Now that the euro price bull channel has held, with a nice bounce off its new double bottom, this places a positive slant on gold for what remains of September. Better, though, would be a move higher to break the $1200 level. As previously noted, this good a performance as a rule is not because of general dollar weakness – a weaker dollar favours both the euro and the gold price; unless the price of gold then takes off to really outperform the euro against the dollar.
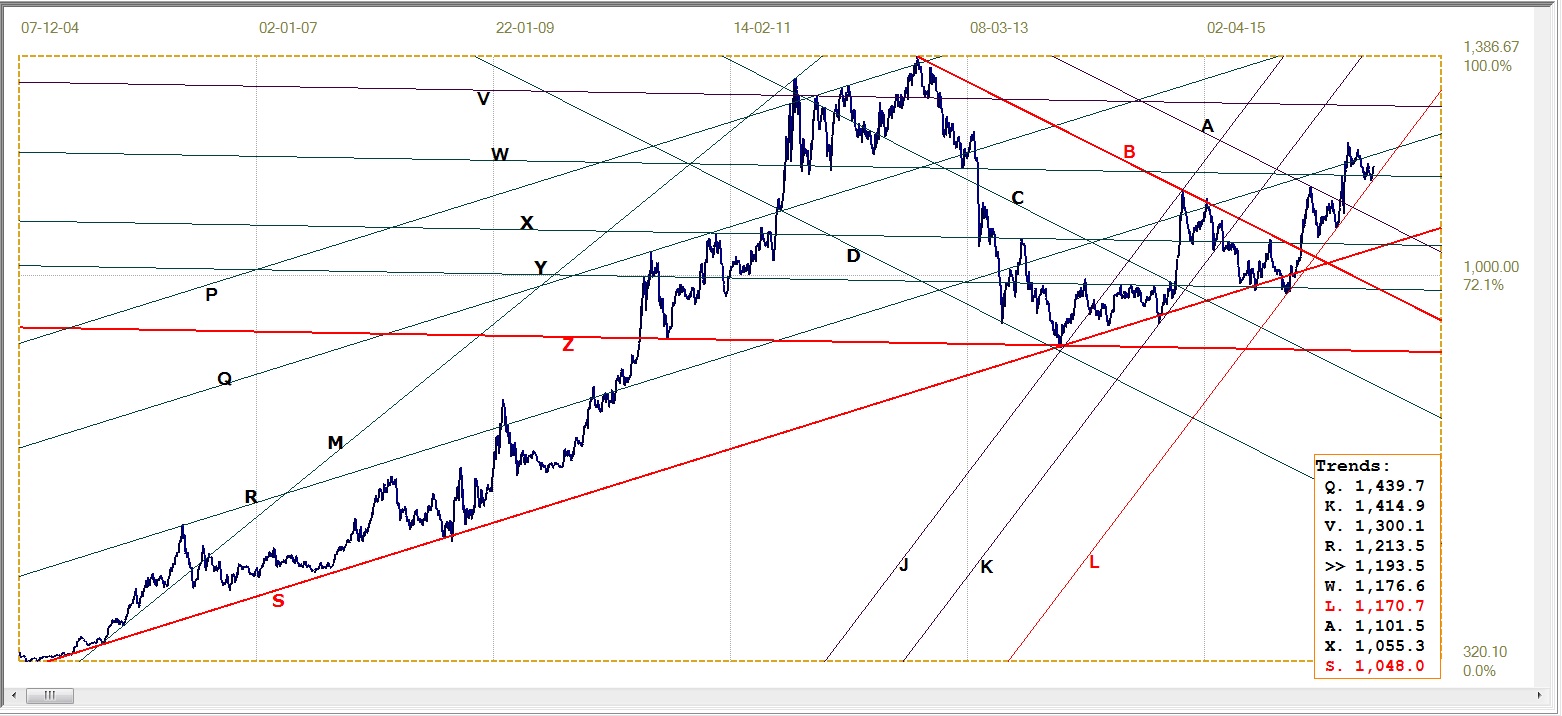
Euro gold price – PM fix in Euro, last = €1193.5 (www.kitco.com)
Silver Daily Fix Chart
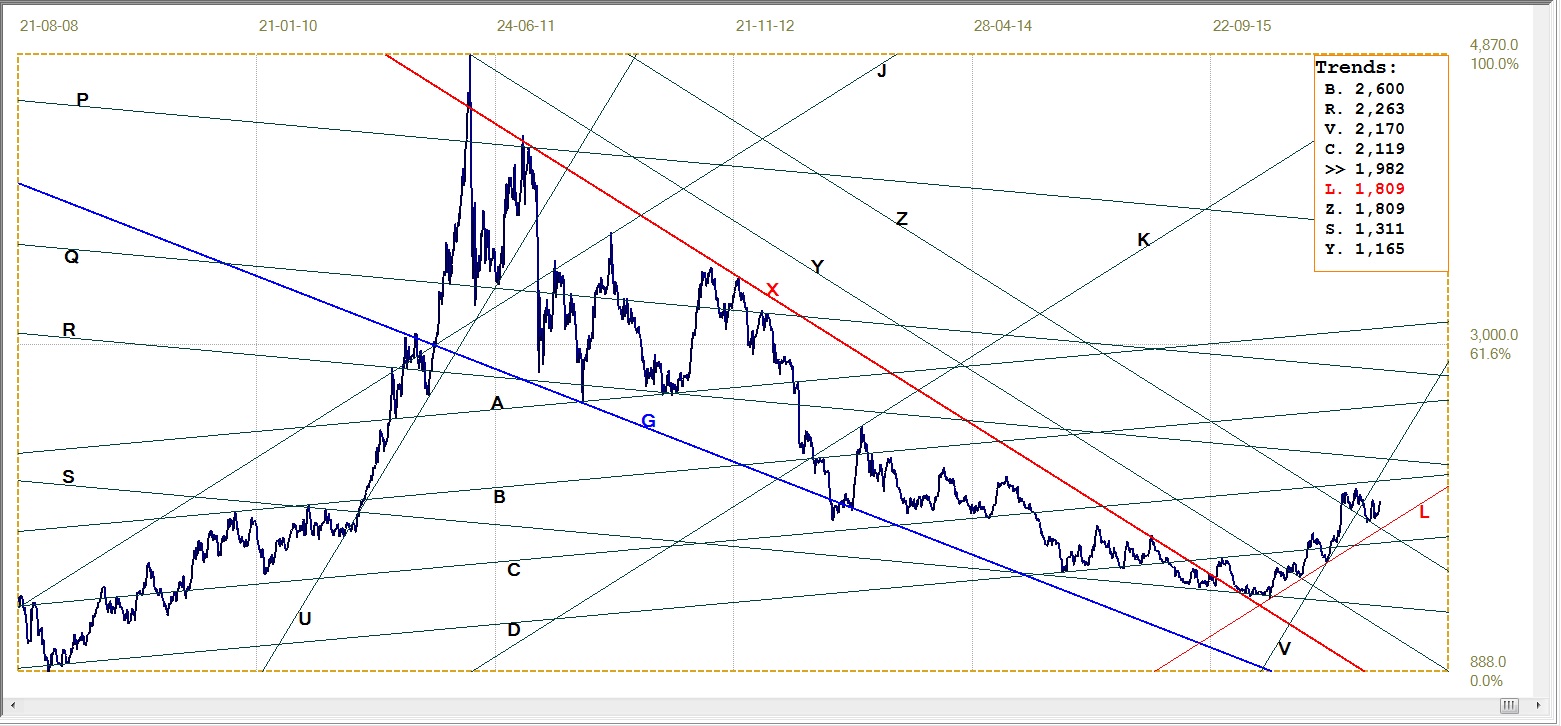
Silver daily fix, last = $19.82 (www.kitco.com )
I now find that last week the text of the silver analysis had disappeared somewhere between me finishing the report and its arrival at Lemetropole. Clearly a case of my fingers not having behaved themselves! Since the chart showed and now still shows little new development – another example of ‘the usual’ at work on the markets – it was no great error.
After the break below the steep support of line V ($21.70) and then the rebound off line Z ($18.09) silver has settled in a quite broad sideways move, swinging up and down with good volatility, so far. Technically, there is in this analysis no definite or clear indication of what the price will do, except perhaps to continue sideways with some volatility. A break below line L ($18.09) to turn bearish, or to above either of lines V or C ($21.19) is needed to confirm that the bullish trend has resumed.
US 10-year Treasury Note
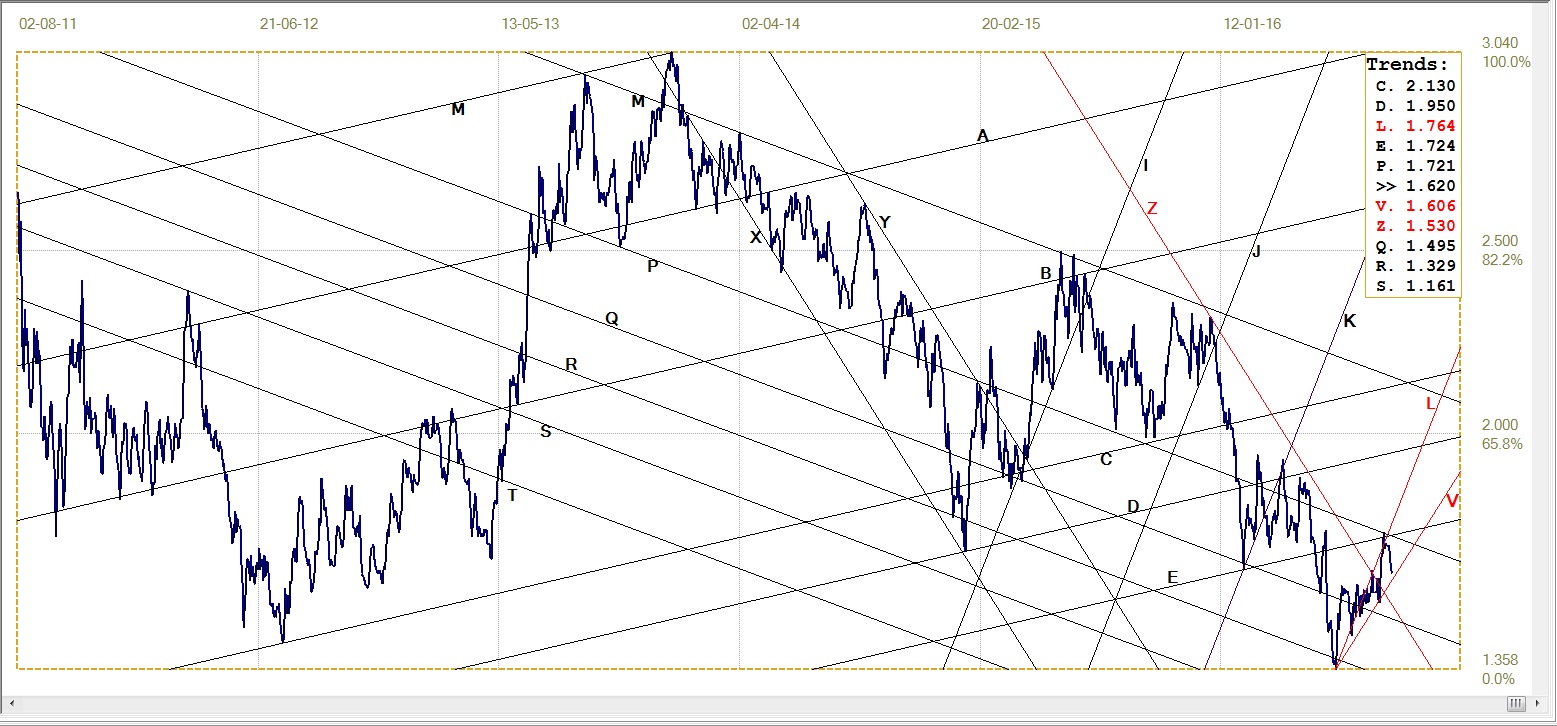
US 10-year Treasury note, last = 1.620% (www.investing.com )
After failing to remain bearish with a clean break above earlier market support at line E (1.724%) and line P (1.721%) the yield was briefly sideways while the bear tried to hold onto the market. This was not to be and late last week the yield fell quite steeply to show a bullish bias.
Line V (1.606%) is new and has been added to indicate possible market resistance for the new rally. A break below line V would confirm a bullish bias for the 10-year note after the break lower below channel KL (1.764%).
West Texas Intermediate Crude. Daily close
After failing to hold the brief break above the $50 level and also above resistance of lines D ($47.13) and S ($48.45), the price of crude began volatile swings between resistance at line D and support at line G ($43.56). A break from a shrinking range between the two trend lines should show the new trend for crude.
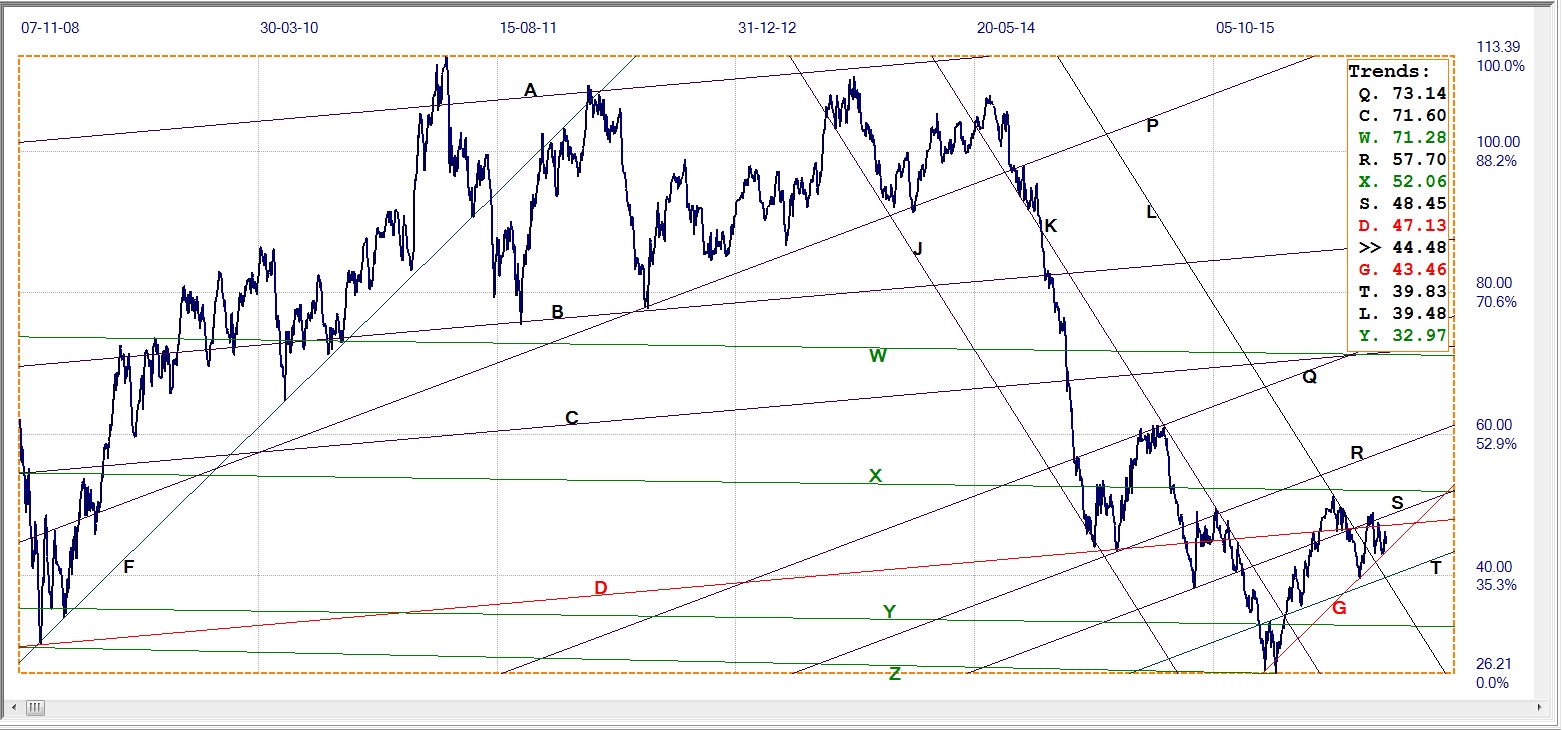
WTI crude – Daily close, last = $44.48 (www.investing.com )
©2016 daan joubert, Rights Reserved
chartsym (at) gmail(dot)com


