EUR/USD Targets Hit - What Comes Next?


• EUR/USD hit not one, but two projected targets,
• DX.F failed its bullish reversal setup,
• and the bigger bearish wedge breakdown from early December is now actively unfolding.
This is one of those beautiful moments when two markets tell one coherent story, and both point in the same direction.
EUR/USD - When a Plan Comes Together

Let’s start with what we wrote in Lab Note #37:
(…) The red declining channel stepped in as support, stalling the drop. Additionally, indicators flashed early buy signals, which translated into a quick reversal and a breakout from both the red channel AND the green rising channel right before yesterday’s U.S. close.
Asia confirmed the breakout, giving bulls room to breathe.
Targets in Play
As long as this move holds, these are the zones we’re watching:
- 1.1745-1.1754: key resistance (61.8% Fibonacci retracement + late October highs)
- 1.1764: upper edge of the purple rising channel
- 1.1785-1.1820: red resistance zone + 78.6% Fibonacci retracement + Oct. 23&24 tops
- 1.1867: textbook channel breakout projection (measured move)
Well… just look at the chart. Not one, but two targets were hit. And yes - that’s your moment to smile. Huge congrats to everyone who took this setup!
What’s happening now?
On H4… The upper border of the rising channel once again acted as resistance - perfectly, actually. The pullback that followed was shallow and tight, suggesting no real panic among buyers. Yesterday, bulls pushed again, but H4 indicators flashed sell signals, and bears stepped in. Instead of a deeper correction, the market slipped into a tight consolidation zone.
Here’s where it gets interesting - this sideways structure mirrors the consolidation we’re also seeing on the daily chart. And when H4 and D1 compress together… something usually pops.
The Bullish Scenario
If price breaks up, an upward move toward 1.1800 will be on deck (at that level it would be equal to the height of the H4 consolidation). Additionally, in this area, the upper line of the purple rising channel sits at the moment of writing these words. A break above 1.1800? That opens the door to the next target we listed on Dec. 11.
Looking at the Daily Chart
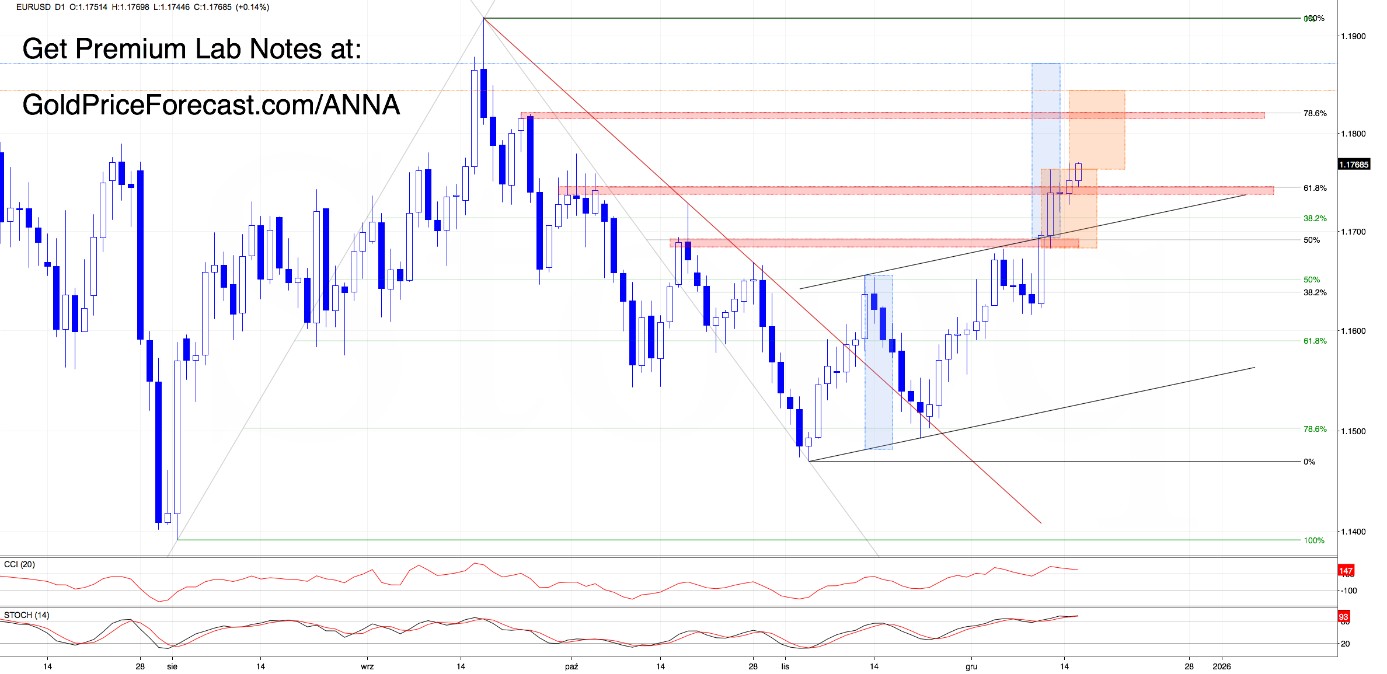
There’s also a bigger consolidation structure with a measured target around 1.1843. And since daily indicators (despite being overbought) still haven’t produced sell signals, bulls do have the wind at their back for now (in other words, overbought doesn’t mean over).
How does this link to the U.S. dollar?
USD Index (DX.F) - The Breakdown That Explains Everything
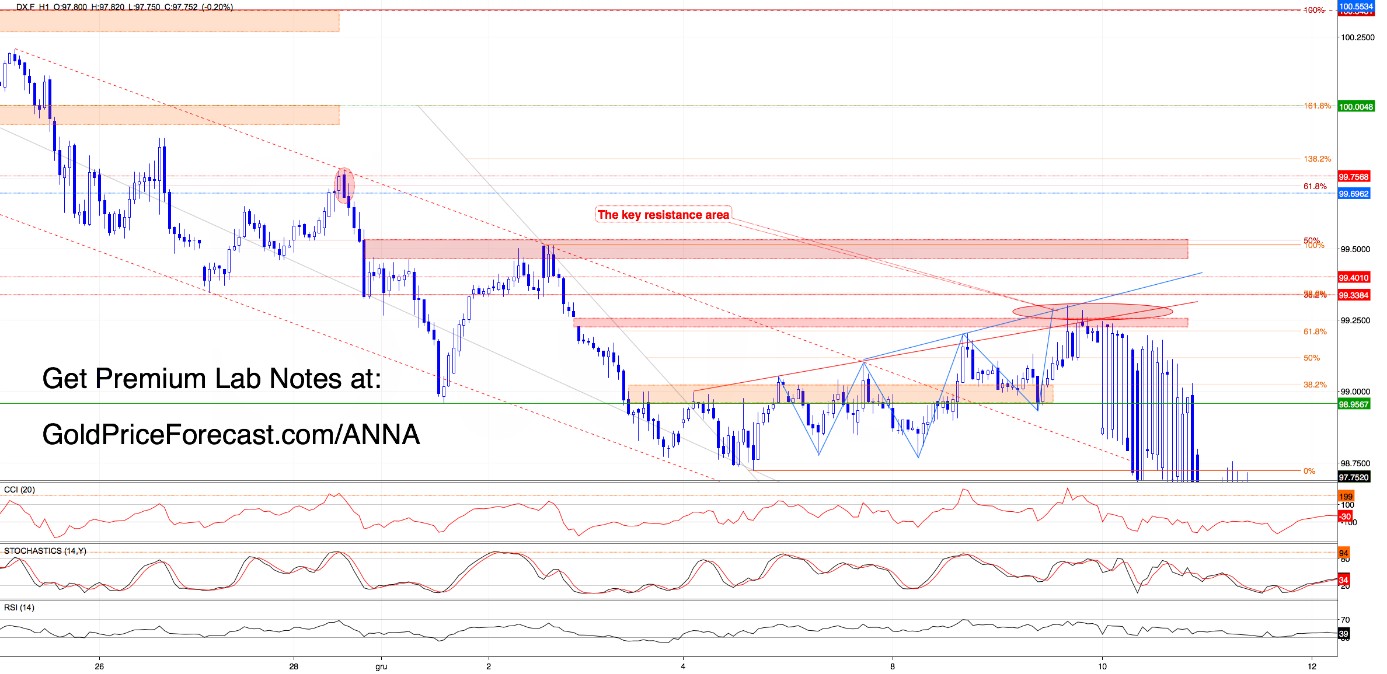
On Dec. 9 (in Lab Note #32), we highlighted a potential bullish reversal setup on the dollar - a possible inverse head & shoulders, BUT we said very clearly:
(…) This is a classic reversal setup but here’s what needs to happen next to activate it:
- Step 1: Breakout above that red resistance zone (which stopped buyers yesterday) again. That’s the first gate, (…)
- Step 2: Confirmation of the breakout above the neckline around the 99.35-99.40 zone.
Why is this zone critical?
Because it combines two important Fibonacci retracements: 38.2% of the entire Nov.20-Dec.5 downward move and 78.6% of the December drop (…)
What happened?
Bulls didn’t even get through Gate #1.
Instead:
- Price stalled exactly at resistance,
- the bearish gap stayed open,
- the failure triggered aggressive selling, and
- on December 10th, bears smashed DX.F to a fresh low.
It looks like bears read Lab Note #24 from December 3rd because they started executing the bigger bearish wedge scenario we mapped there:
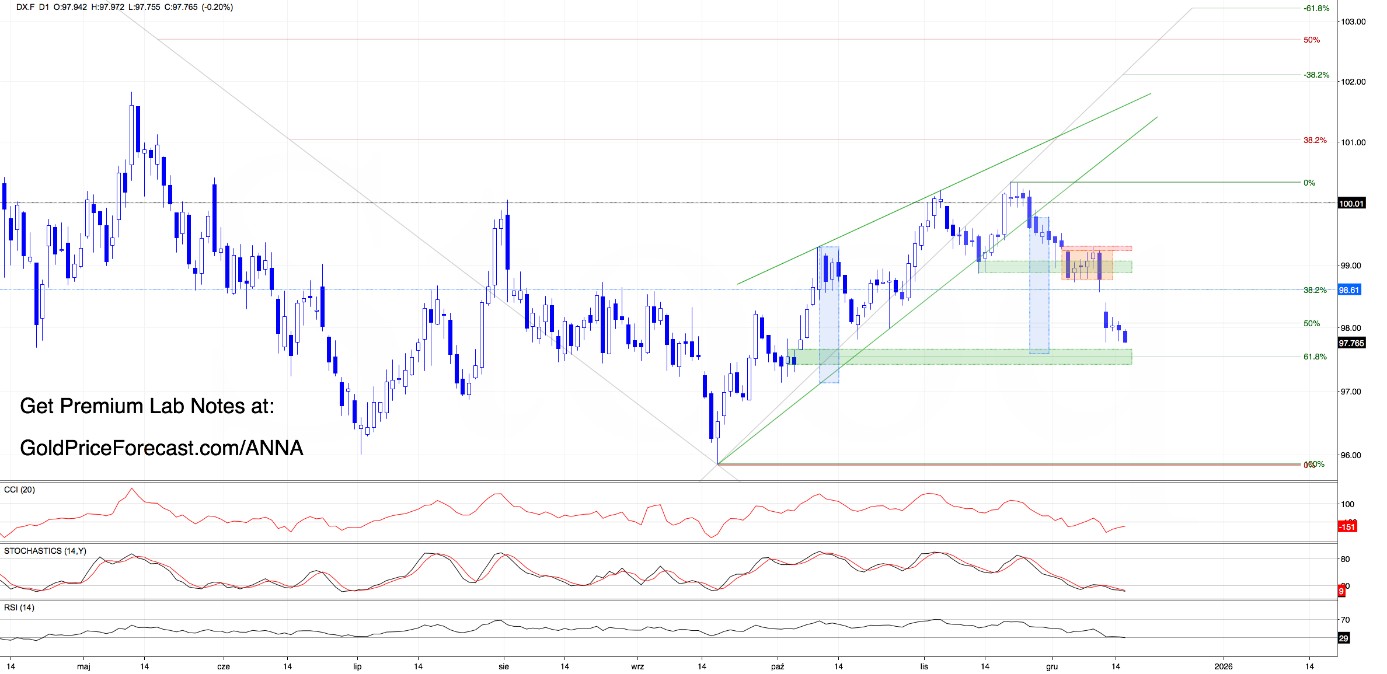
“This is a bigger-picture signal that shouldn’t be forgotten:
The dollar is still trading below the broken rising wedge structure on the daily chart. If bulls fail to defend the green support zone, the wedge breakdown scenario could come alive with a potential move all the way to 97.61, where the wedge’s measured target intersects a still-open bullish gap from early October. “
Fast forward to today… DX.F is already below 98, and yes - it is now very much on track toward that 97.61 target.
What Should Traders Watch Now?
There’s a major support cluster slightly below created by the open green bullish gap from Oct. 6 and the 61.8% Fibonacci retracement. Therefore, if that zone holds, we could see a U.S. dollar rebound, and that bounce won’t be neutral for EUR/USD.
Why does this matter?
Because EUR/USD has been rising with the falling dollar. A DX.F bounce could delay EUR/USD’s bullish targets OR force a deeper pullback before the next leg up.
This is especially important now that EUR/USD is near important resistance levels.
And what if the support zone breaks?
If the mentioned support zone in DX.F fails, bears could open the door to 78.6% Fibonacci retracement, and the September swing lows (around 96.86). Such a scenario would give EUR/USD plenty of room to extend higher, but it would also raise the risk of sudden volatility spikes along the way. Therefore, keep your eyes glued to that zone.
Lab Takeaway - What to Watch Today?
EUR/USD is still bullish as long as price holds above the breakout zone, but momentum is slowing - so don’t chase, wait for confirmation.
On the USD Index, bears remain in full control until the 98.00–97.60 support zone is tested, and this zone will likely decide the next major swing on EUR/USD.
If the dollar bounces there, expect EUR/USD to stall or correct; if the zone breaks, the path toward higher targets will likely open fast.
Today is all about letting the charts reveal which scenario is activating - stay patient, stay tactical, and let price come to your levels instead of forcing a trade.
If you want to catch moves like today’s when they’re setting up, not after they’ve already played out, consider upgrading to the Premium Lab Notes. You get the real-time levels, the breakout conditions, and the invalidation points exactly when they matter - not a day later. Members were prepared for this entire sequence, from setup -> confirmation -> target.
If you want to trade with that kind of clarity, the door’s open.
Premium Access: Anna’s Trading Lab
******
More from Gold-Eagle


