An Excerpt On A Key US Dollar Fundamental


Currencies
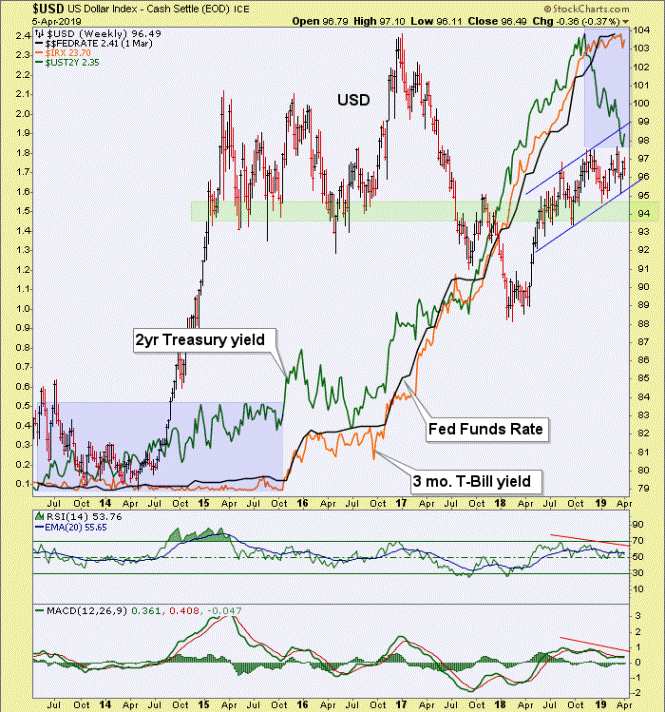
A reminder that we are not using the standard gold bug method of evaluating the USD (perma “death to the dollar!!”). We are using fundamentals in evaluating its potential to correct (and launch a global macro trade). The blue shaded boxes on this weekly chart tell the story of Fed policy (Fed Funds/3 mo. T-Bill) that significantly lagged the upturn in the 2yr yield into late 2015. But USD turned up much earlier (in 2014) to follow the 2yr.
Today we have an opposite situation. The 2yr has turned down (putting the Fed in dove mode) but Fed policy is going sideways. We are relatively early in a new blue box and if the correlation between USD and the 2yr holds (in reverse) either USD will correct soon or the 2yr will rise again (and whipsaw an increasingly clownish looking Fed).
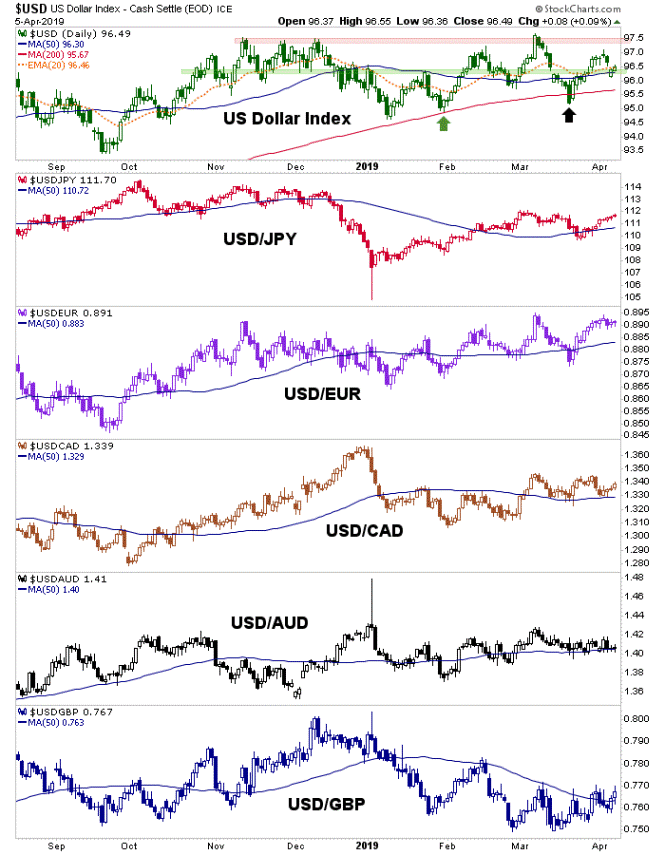
And so here we find the index potentially in a small bear flag as it tries to hold support at the SMA 50. What I don’t like if I am an Uncle Buck fan is that it broke to a new high and then failed to a precarious low. It seemed an impulsive move. Of course the buck was going to then rally again because post-FOMC everybody got on the weak dollar train. Was that downside a scout for coming bearish activity?
To help answer that question we turn to the Fed Funds Futures wise guys at CME Group.
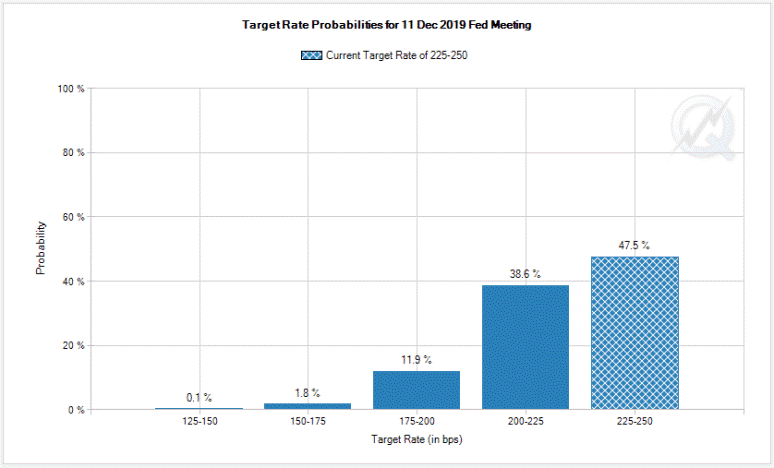
Not only do these players not see a coming rate increase, they actually still see increasing odds of a rate cut coming by year end. The above is just the December snapshot, but if you go meeting by meeting, these odds makers see no hikes gradually leading to a possible rate cut in 2019.
What I simply don’t get is the US stock market flying around up there testing its highs. This is the best of all worlds for Donald Trump, a tantrum throwing rich kid come real estate baron who is used to getting his way at all times.
I still don’t buy the crap out there about Jerome Powell being weak and giving in to Trump and the powers that be. I buy what I see with my own two eyes and what I see is a 2yr yield that began to drop in earnest in Q4 2018, triggering the dovish Fed.
Bottom Line
The Fed is doing what it would normally do when given weak signals from the bond market (strong bonds, weakening yields) and going into dove mode. But the stock market has gotten no such memo about weakening.
If stock market strength is indicating that a soft patch in the economy is passing (eyes on the Semi sector, especially) then the Fed is being whipsawed into overly accommodative policy, which could launch a serious cost-push inflation issue. If the 2yr yield is right, then there could yet be a long way for equities to fall because the initial stages of a Fed weakening cycle usually see assets dropping into a deflationary event. More to follow as we develop the story and flesh it out.
Subscribe to NFTRH Premium (monthly at USD $33.50 or a 14% discounted yearly at USD $345.00) for an in-depth weekly market report, interim market updates and NFTRH+ chart and trade setup ideas.
You can also keep up to date with actionable public content at NFTRH.com by using the email form on the right sidebar and get even more by joining our free eLetter. Follow via Twitter @BiiwiiNFTRH, StockTwits or RSS.
********
More from Gold-Eagle


