Fear Reaches A Level Seen Only 4 Times Since 2008 – Signature Pattern


Since 2009 the stock market has had for major waves of investor fear (volatility) take place which was in 2010, 2011, 2015, and 2018. Each time the market corrected we saw a drop anywhere from 12% – 18% and both traders and investors became emotional and started selling assets in fear of lower prices. What we are experiencing right now is the same sort of setup once again.
These waves of panic selling are a signature pattern of a mini-crash and they have similar outcomes each time which I will share with you here so you know what to expect and how to trade this rare market condition.
It takes a lot to convince the masses to reach this level of fear. Each of these mini-market crashes there has been some catalysts to further induce fear/selling. This time its Covid-19 that is tipping the scales.
Only two assets have acted as a safe haven which is bonds, and gold. Once again everyone has been piling into these over the past week, and even more so on Friday with Bonds surging 6.5% at one point during the session.
What does it mean when everyone is buying bonds and gold like this?
Where should you put your money to work going forward?
If you are thinking of buying bonds or gold you may want to think again.
Take a look at the charts for gold and bonds below when fear and the volatility index (VIX) have reached the level we experienced last week.
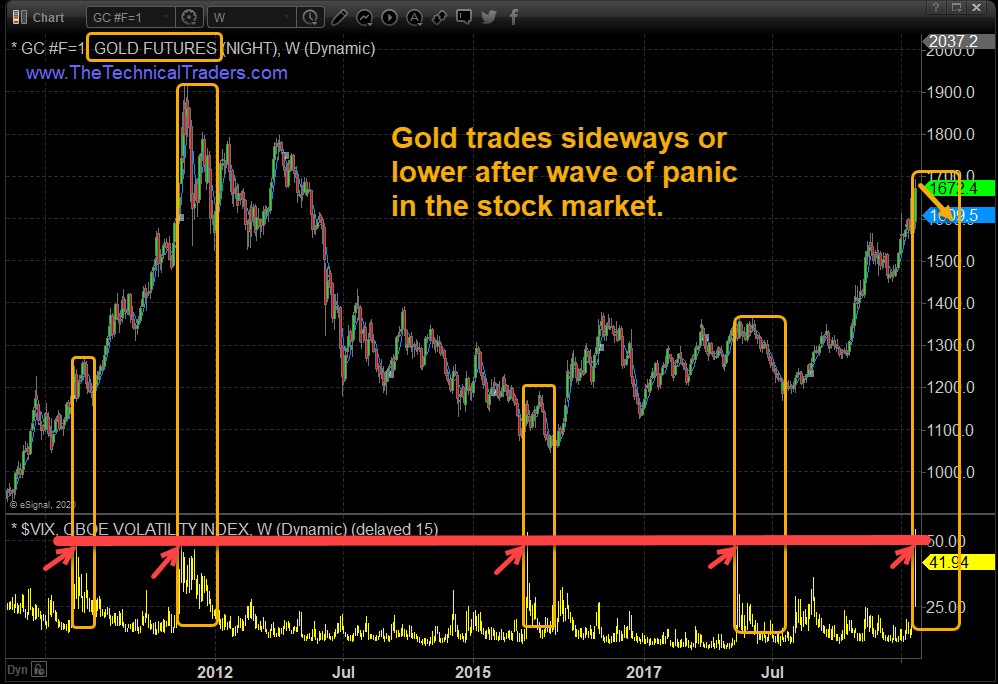
Weekly Chart of Gold, and the VIX Performance
The chart below is straight forward. The bottom yellow section is the level of fear (VIX), while the top candlestick chart is the price of gold.
This chart shows what happens to the price of gold when everyone becomes fearful. Gold tends to rally as fear rises and the VIX spikes. But once the VIX has spiked the price of gold will trade sideways for many weeks and eventually have a deeper correction.
While gold could see more fear-based buying in the next week or two I feel most of the upside potential has always been realized and your money will be stuck in an underperforming asset when it could be deployed elsewhere in the market.
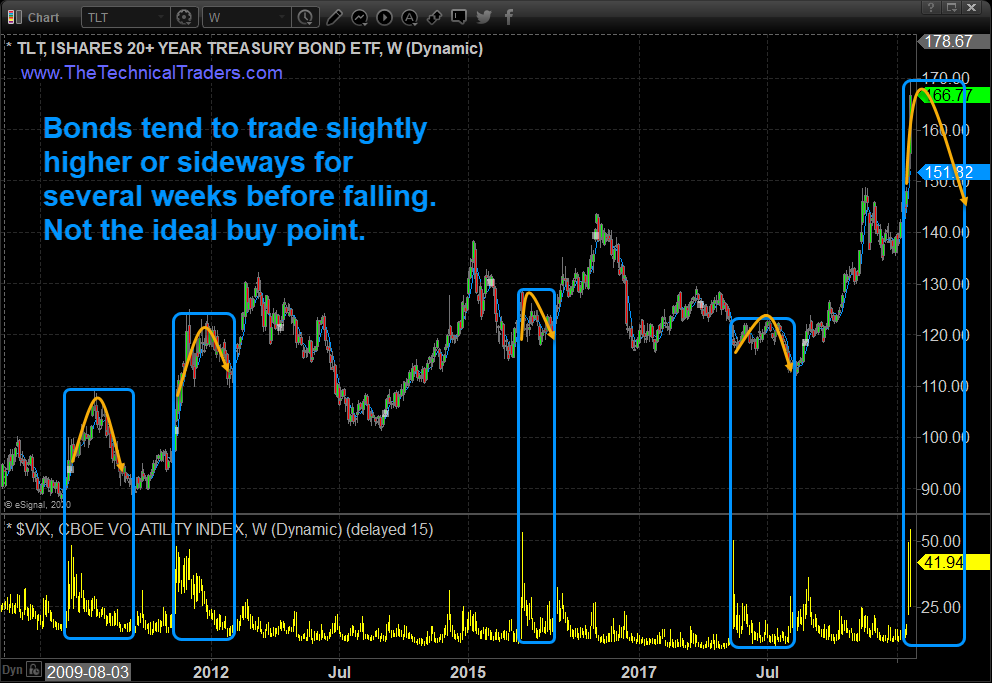
Weekly Chart of Bonds (TLT), and the VIX Performance
The below chart of bonds is a little different in how it reacts to extreme broad-based fear. Bonds tend to trade sideways or higher for a few several weeks and this is because bonds are really the core safe-haven play amount investors and financial advisors.
When extreme fear hits the market and spooks the masses it can take weeks for all those buy and hold investors recognize the market weakness and take action selling their stocks and moving their money into bonds. This buying pressure on bonds is a slow trickle-in effect as advisors have clients call them and demand they put their money into a low-risk investment like bonds.
Bonds do have another interesting twist for last week’s particular price action. Only three times since 2008 have I seen bonds move 20% in value within a short period of time which is what they reached last week. Within 1-3 weeks from a 20%+ gain, the price of bonds has corrected on average 11.5%.
Concluding Thoughts:
In short, my 23 years of technical analysis experience in reading charts, and statistical analysis is telling me we should be looking at different asset classes to trade over the next couple of months.
On Friday at the opening bell subscribers and I closed our TLT bond trade for a 20.07% gain. During that time the stock market crashed 14.5% which we avoided because of our technical analysis which closed our long SP500 position before the big drop.
As a technical analysis and trader since 1997, I have been through a few bull/bear market cycles. I believe I have a good pulse on the market and timing key turning points for short-term swing traders.
Visit my ETF Wealth Building Newsletter and if you like what I offer, and ride my coattails as I navigate these financial markets and build wealth while others lose nearly everything they own during the next financial crisis.
Chris Vermeulen
www.TheTechnicalTraders.com
********

Chris Vermeulen has been involved in the markets since 1997 and is the founder of Technical Traders Ltd. He is an internationally recognized technical analyst, trader, and is the author of the book: 7 Steps to Win With Logic
Through years of research, trading and helping individual traders around the world. He learned that many traders have great trading ideas, but they lack one thing, they struggle to execute trades in a systematic way for consistent results. Chris helps educate traders with a three-hour video course that can change your trading results for the better.
His mission is to help his clients boost their trading performance while reducing market exposure and portfolio volatility.
He is a regular speaker on HoweStreet.com, and the FinancialSurvivorNetwork radio shows. Chris was also featured on the cover of AmalgaTrader Magazine, and contributes articles to several financial hubs like MoneyShow.com.
More from Gold-Eagle


