February 2018 Market Crisis – What Next?


We’ve received many comments and questions from our members over the past few days regarding the recent US market crisis asking what to expect next. Is this the start of something bigger? Deeper? What should I do with my open long positions? What should I do to prepare for anything in the future? All of these are valid questions. So, we wanted to help our members and all of our followers by showing what we believe will be the most likely price action going forward a few weeks out.
The recent downside moves in the US majors did freak a lot of people out. It was something that startled people and pushed a panic button for many. Certainly, the rotation in the VIX and volatility related ETN’s pushed many people over the edge. In fact, recent news is that these volatility related ETN’s exasperated the selloff as the VIX shorts were pushed out of positions and into a protectionist mode with the massive spike in volatility. As the old floor trader saying goes “want to know what causes the markets to crash? Buyers that turn into sellers to protect from unwanted losses”.
In fact, the fear and selling were so strong it sent the safe havens tumbling lower, which we took advantage of trading the DUST gold miners ETF for a quick 20% profit.
Well, now that this rotation appears to be almost over either this week or early next week, let’s take a look at some of the technical channels and fundamentals that should drive the markets going forward.
First, we have strong economic and fundamental US and global data that is showing increases in the global economy, GDP, output, employment and more. In reality, the global markets are pushing hard for greater growth. The one factor that is still concerning for us is the US Fed and Interest Rates as well as regional housing levels. We have been watching these levels quite closely over the past few months and watching what is happening in major metros across the US and globally. We are still seeing price appreciation and strong activity in most locations which indicates the top has not formed yet.
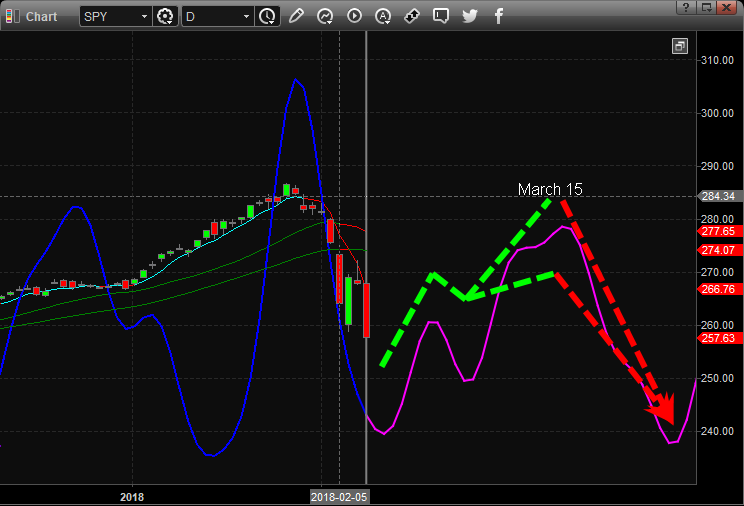
Therefore, we believe this February market crisis is, as of right now, a unique instance of a “shakeout” after a lengthy period of very low volatility. Almost like the market needed to “breathe” and in order to do that, it needed to roll out of a low volatility range. Now that this is taking place now. We believe the markets are setting up for a very quick FLAG/Pennant formation that will prompt a burst higher towards a March 15th peak.
This chart of the daily SP 500 (SPY) is showing our primary longer-term price cycles. As you can see, this chart is showing that a bottom in price cycles is happening this week and next and that we would likely see price rotation and moderately higher price activity over the next 3~5+ weeks. We are still expecting weakness that could retest the lower price channels (which you will see in additional charts), but overall we are expected a very quick and tight FLAG/Pennant price formation that will consolidate price before an upside price breakout.
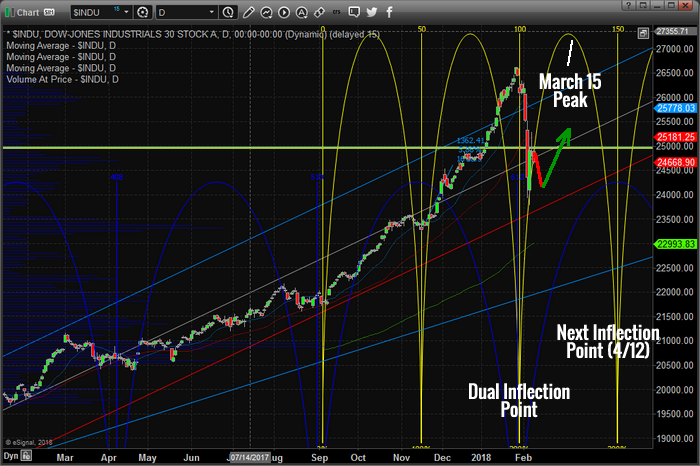
This chart of the INDU (Daily) shows our cycle analysis and key cycle points. Notice the Dual Inflection Point in early February that warned of a potential price reversal/correction. Also, pay attention to the price channels that are at play in the current uptrend. These tell us that this recent price rotation was critical for the global markets to “breathe” and rotate in a very healthy way to allow for further growth. The markets had been in such a tight volatility range for over 11 months and this type of price movement is somewhat unhealthy. The market operates on the premise that price continually rotated (attempts new highs or new lows) and without that rotation, the market becomes heavily biased to one side or the other.
These cycle points play a role in telling us when to expect potentially critical market turning points and what to expect in terms of intensity of price swings. This recent downside move was aggressive in nature and we believe this is relative in terms of how narrow the volatility (VIX) had become. In other words, the markets had been so tight and narrow (biased) that breadth was minimal. The markets needed this type of rotation to allow for further price moves.
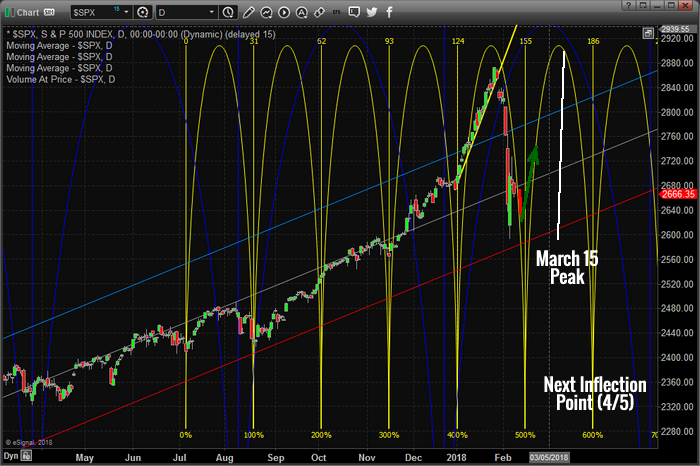
This second chart is the SPX (Daily) showing the same cycle points and analysis. This shows us that the cycles in the SPX are different than those in the INDU, yet the cycle analysis still supports our final outcome that is the markets will form a bottom rotation and advance higher in the immediate future. Notice the short term (yellow) cycle levels that show prices will be rotating very soon and understand that our predictive modeling systems are telling us that sometime near March 15th will be a market peak.
Putting all of this together, our analysis is that the markets will continue to rotate in a moderately wide range while creating a very quick and tight FLAG/Pennant formation. Culminating in a price breakout, we believe to the upside, in correlation with the predictive analysis that is telling us of a March 15th price peak. Therefore, we believe this rotation was a healthy move that allowed the markets to recover a functional price range (creating support and resistance) that could prompt further price advances.
Certainly, there is the risk of further downside price activity. Certainly, some news item could come out in the future that could drive the markets substantially lower. We believe the US and Global markets are strong fundamentally and that the new growth in the economic output will continue to try and push equities higher as expectations of increased global economic activity continues. Immediately, we are targeting the March 15th price peak. From that point, we will reevaluate our analysis and update our members.
In a video I posted the other day I walk you through gold, stocks, volatility, vix, and bitcoin using my predictive price cycle analysis and technical analysis show your where these asset classes should be headed next.
Also, I had a great conversion with Cory Fleck from the Korelin Economics Report you should hear.
*********
Between my research team and I, we have 53 years experience in researching and trading makes analyzing the complex and ever-changing financial markets a natural process. We have a simple and highly effective way to provide our customers with the most convenient, accurate, and timely market forecasts available today. Our stock and ETF trading alerts are readily available through our exclusive membership service via email and SMS text. Our newsletter, Technical Trading Mastery book, and 3 Hour Trading Video Course are designed for both traders and investors. Also, some of our strategies have been fully automated for the ultimate trading experience.

Chris Vermeulen has been involved in the markets since 1997 and is the founder of Technical Traders Ltd. He is an internationally recognized technical analyst, trader, and is the author of the book: 7 Steps to Win With Logic
Through years of research, trading and helping individual traders around the world. He learned that many traders have great trading ideas, but they lack one thing, they struggle to execute trades in a systematic way for consistent results. Chris helps educate traders with a three-hour video course that can change your trading results for the better.
His mission is to help his clients boost their trading performance while reducing market exposure and portfolio volatility.
He is a regular speaker on HoweStreet.com, and the FinancialSurvivorNetwork radio shows. Chris was also featured on the cover of AmalgaTrader Magazine, and contributes articles to several financial hubs like MoneyShow.com.


