A Food Mixer World


Perhaps the 0.25% increase in rates will in due course be seen as the real bad news of the Ides of March week, but so far it is for Wall Street a reason to rally enough to set a new intermediate high on recent record daily volume. We are living in a strange new world, where 2+2 no longer equals 4, but any number that the nebulous powers that be behind the thrones want we the people to accept as the correct answer. Much worse, the correct answer changes over time at the whim of whoever in power wants it to be irrespective of reality as we observe it. 1984 is more alive than ever before.
Do you happen to remember two years ago, “We are instituting harsh lockdown and other regulations for 2/3/4 weeks to ‘flatten the curve’ so that hospitals would not be swamped with cases. After that life can return to normal.” Then almost a year later, “The vaccines are safe and effective and when enough people are vaccinated we will achieve herd immunity and the pandemic will be over.” Or, “To make America great again we need to rebuild our manufacturing capability,” and “We desperately need to be self-sufficient as far as our energy requirements are concerned and not be reliant on imports that might not be there when we need them.” Paraphrased and not exact quotations, but the gist is there. The world is changing and now rather more rapidly than ever before.
How many people, at least the rational, thinking people, are looking forward to living in the world after the WEF’s ‘Great Reset’ in which, as the new slogan goes, “Everyone will own nothing, but be happy”? This implies a change for people to stop living, but keep on existing. In terms of the timing, this raises questions whether the current war was ignited by pushing Russia into a too uncomfortable corner in order to preserve US hegemony or was it to promote the establishment of the one world government of the Great Reset? Or both? Until 2020 the answer would have been the first alternative, but now it looks more and more as if the other alternatives take precedence.
Long established customs and policies of the US and other power blocs appear to be in turmoil, with changes happening fast and furious compared to what used to be viewed as an historical time scale. Such changes used to happen gradually over a decade and longer; now they are done in a matter of months to a year or so. Even semi-ignorant Fact-checkers employed by the media cannot keep up with what is misinformation at the current moment in time. Did the Covid virus originate in a wet market in Wuhan, or did it escape from the Wuhan S4 lab? Is that lab funded by the US and do Americans also work there? Is the virus an invention covered by a US patent or not? Only some of the conundrums faced by the blinkered fact-checkers employed by social media.
It is now fully accepted for government and others in some position of authority to lie and otherwise distort the truth, while the media accept what these people say and do their utmost to blank out any dissent to, or even just questioning of, official narratives. Normal people end up as if in a food mixer running at speed; nothing is a constant to allow one to get one’s bearings in this topsy-turvy new world. Nobody to really trust.
At least technical analysis still provides a view of the markets that can be examined and tested against performance over time. What is happening on Wall Street has at least three possible explanations: investors are certain of hyper-inflation and want to get rid of all their cash to put it into something with ‘real’ value, like equities, even borrowing to buy more for later profit; second, our economy is sound and now ready for a boom in which there is little inflation and no supply side risk; thirdly, the edict from pre-Trump, that the stock market must always signal all is well in the economy so that voters think well of the administration, has been dusted off and made more strict. Now the Fed acts preemptively to counter any possible retreat before it can begin. Your choice of the three, or join me in the runaway food mixer if you can’t decide. The many other questions of concern about the state of the country and the world have more difficult answers.
Late last week, the pennant on the S&P500 daily close broke to the upside at the end of leg 5 of the formation – exactly as traditional interpretation of the chart pattern will have it. In principle this implies that the bull market is intact and will resume now that the consolidation pattern has been completed. Typically, if the pennant has traditional predictive powers, the new move higher will extend as far as the ‘flag pole’ – the rally – on which the pennant is hanging, which here extends from the low of the Covid sell-off in March 2020 at 2237 to the recent all time high at 4797, or 2560 points to put the target from near the recent low at 4173 near a new high 6730, a gain of 50.8%.
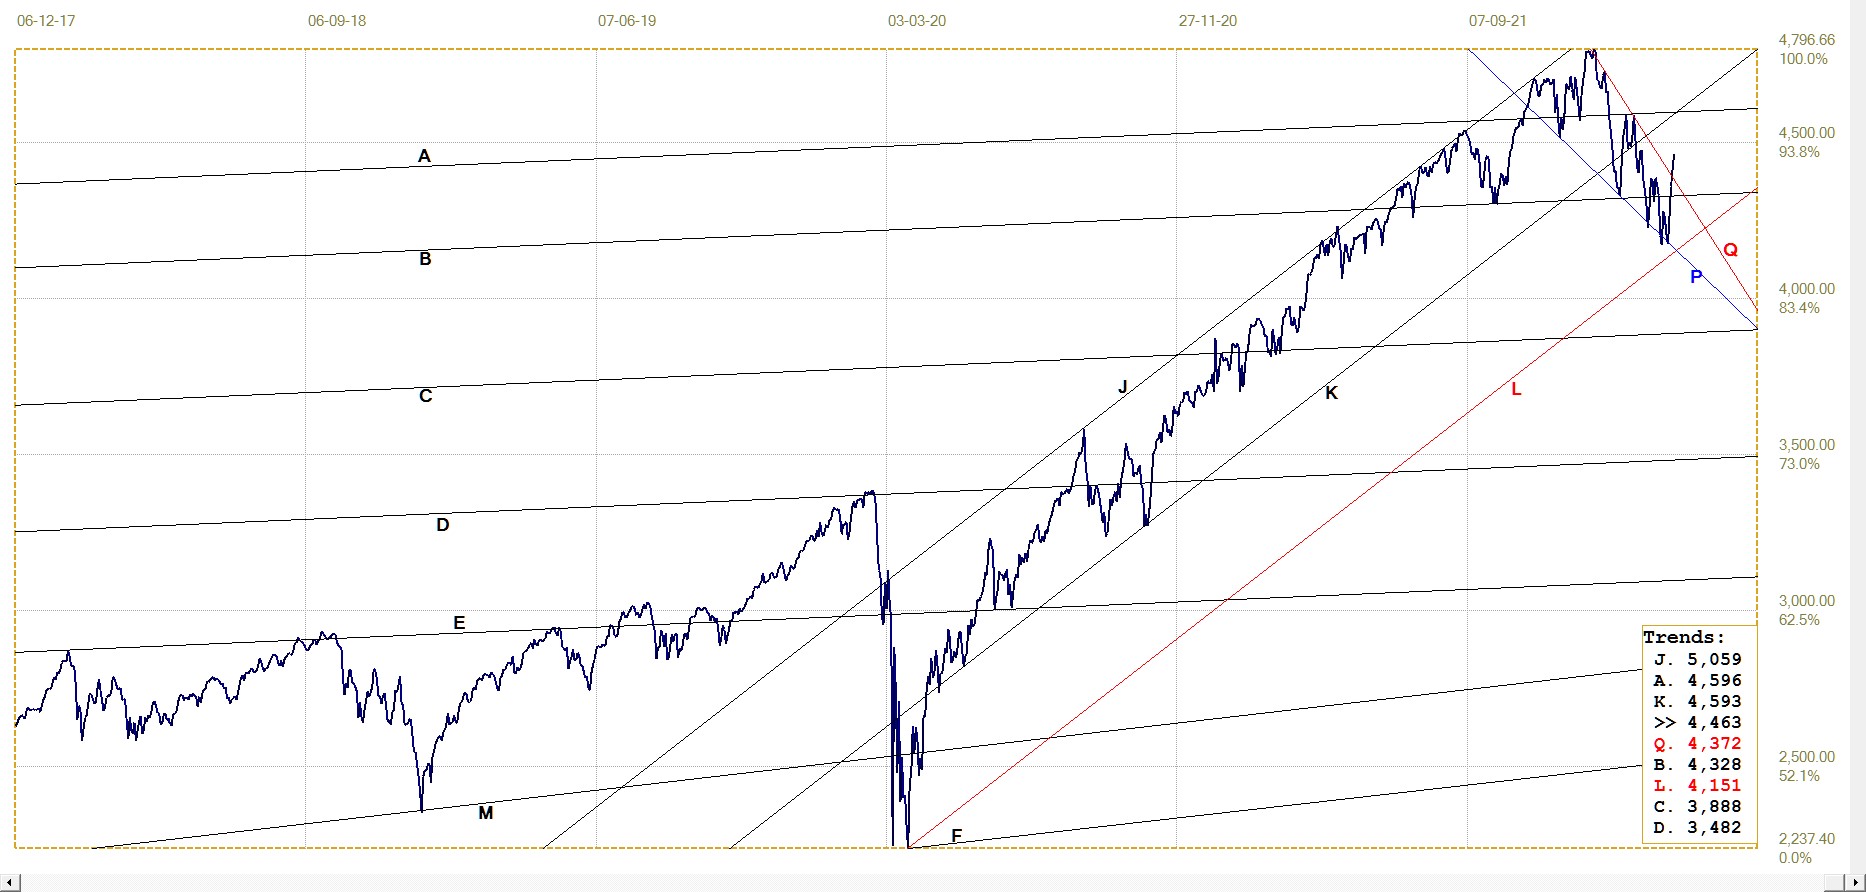
S&P500 Daily close. Last = 4463.12
So if the traditional technical guideline for triangular or wedge shaped consolidation patterns holds true, the probable explanation for the recent stellar performance on Wall Street has to be either a massive boom in the US economy started last week, or the alternative of hyperinflation of the dollar is at hand and equity prices will rally as they compensate for the loss of purchasing power. Some might reason that hyperinflation will result in a much weaker material economy, which would be bad for profits and thus for equities. If valid, to rule out hyperinflation, this would mean the only viable explanation for the upside break from the pennant has to be that the US economy stands ready to enter a major boom period. QED.
In 1996 I was put onto the gold price suppression scheme when an 18 month triangle broke to the upside as it should have done. However, the break above $400/oz then out of the blue reversed direction to begin the decline to near $250 four years later. It was an event that pertinently informed me that TA only reflects the normal market forces at work. When a strong outside force intrudes into the market and manages to take control, the results do not follow the traditional charting patterns.
Therefore, one should look to the possibility that the Fed has taken control of Wall Street and the upside break from the pennant, which many analysts might observe and comment upon its bullish implications, is a false signal due to an outside force. In the case of gold, the force has remained dominant nearly consistently for most of 26 years. I rather doubt that the effort of the Fed can last that long.
Here is a link to a podcast by Dexter White on the Ukraine situation that is of interest and here are some of the comments that his podcast elicited. We now find ourselves being churned around in the food mixer; however, there are some among us who do think and they are better aware of what is really happening.
Euro–dollar. Daily close
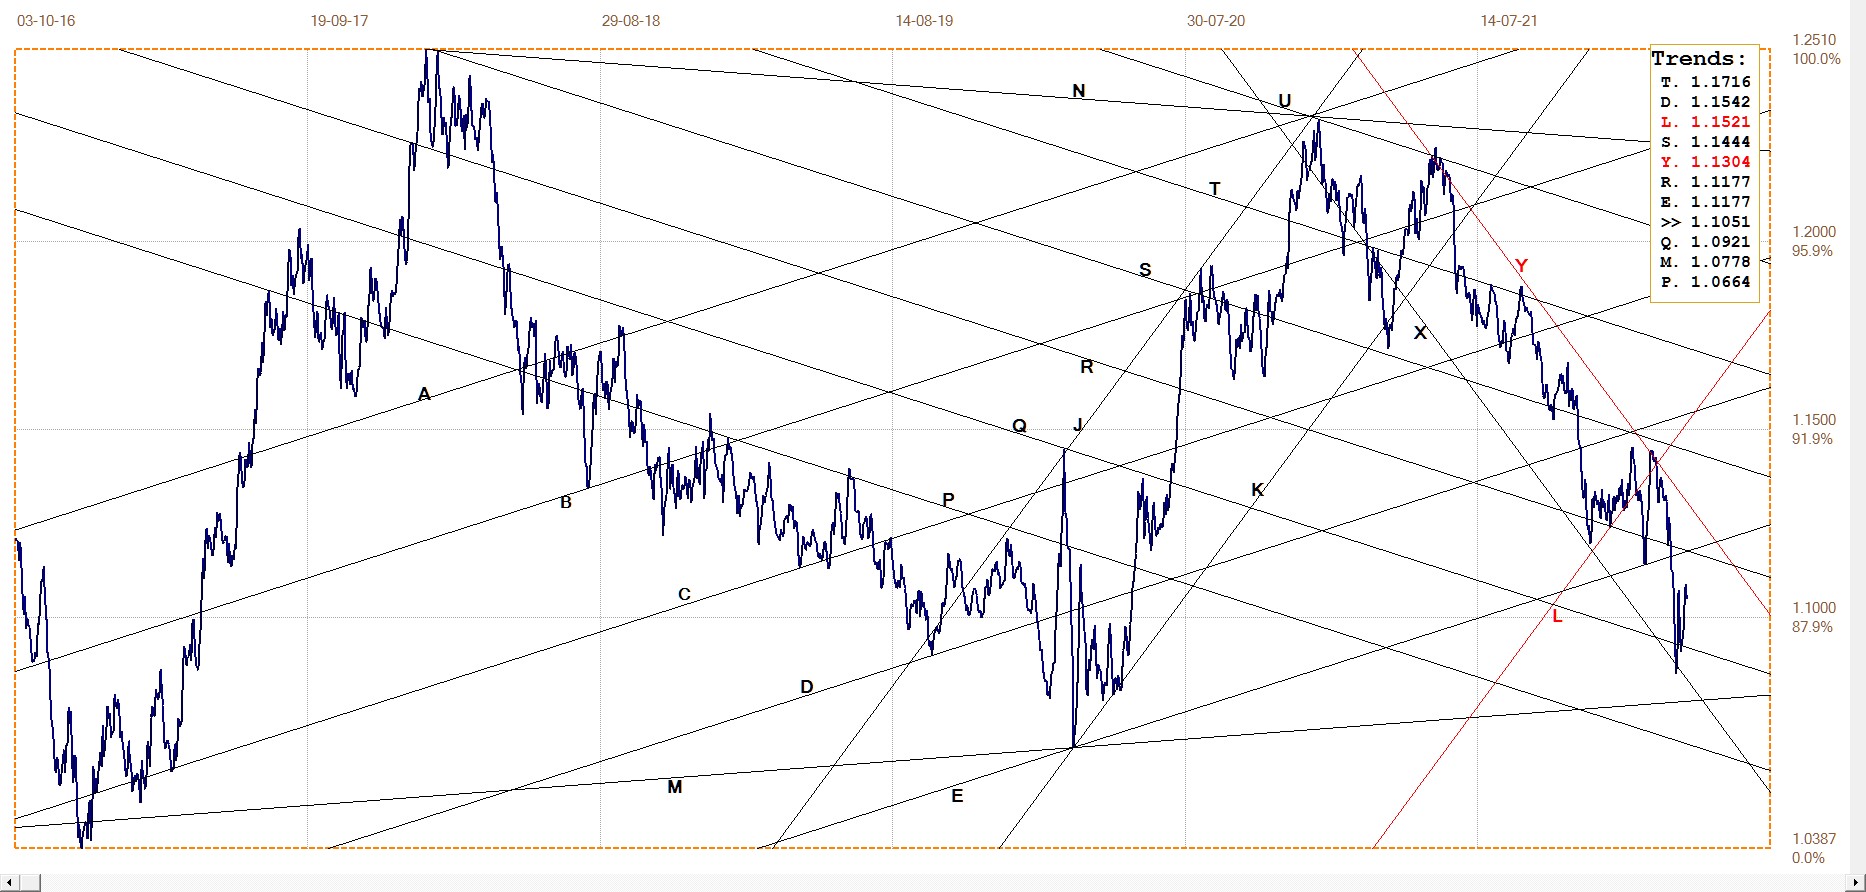
Euro–dollar, last = $1.1051 (www.investing.com)
The near two year bear market in the value of the euro against the stronger dollar has kept well within steep channel XY. The sustained slide of the European currency at first held for some time at the support of its broad bullish channel AR, for a bit of a bounce, but then its value plummeted as the economic and geopolitical effects of the war in Ukraine continued to increase.
A steep spike lower to reach the bottom of channel XY, suddenly reversed higher off the support of line X when it was reached. Whether the reversal is the beginning of a new euro rally or simply a reaction of being oversold, time will tell. The euro has quite some way to go to break above channel XY to obtain a bullish bias again.
DJIA daily close
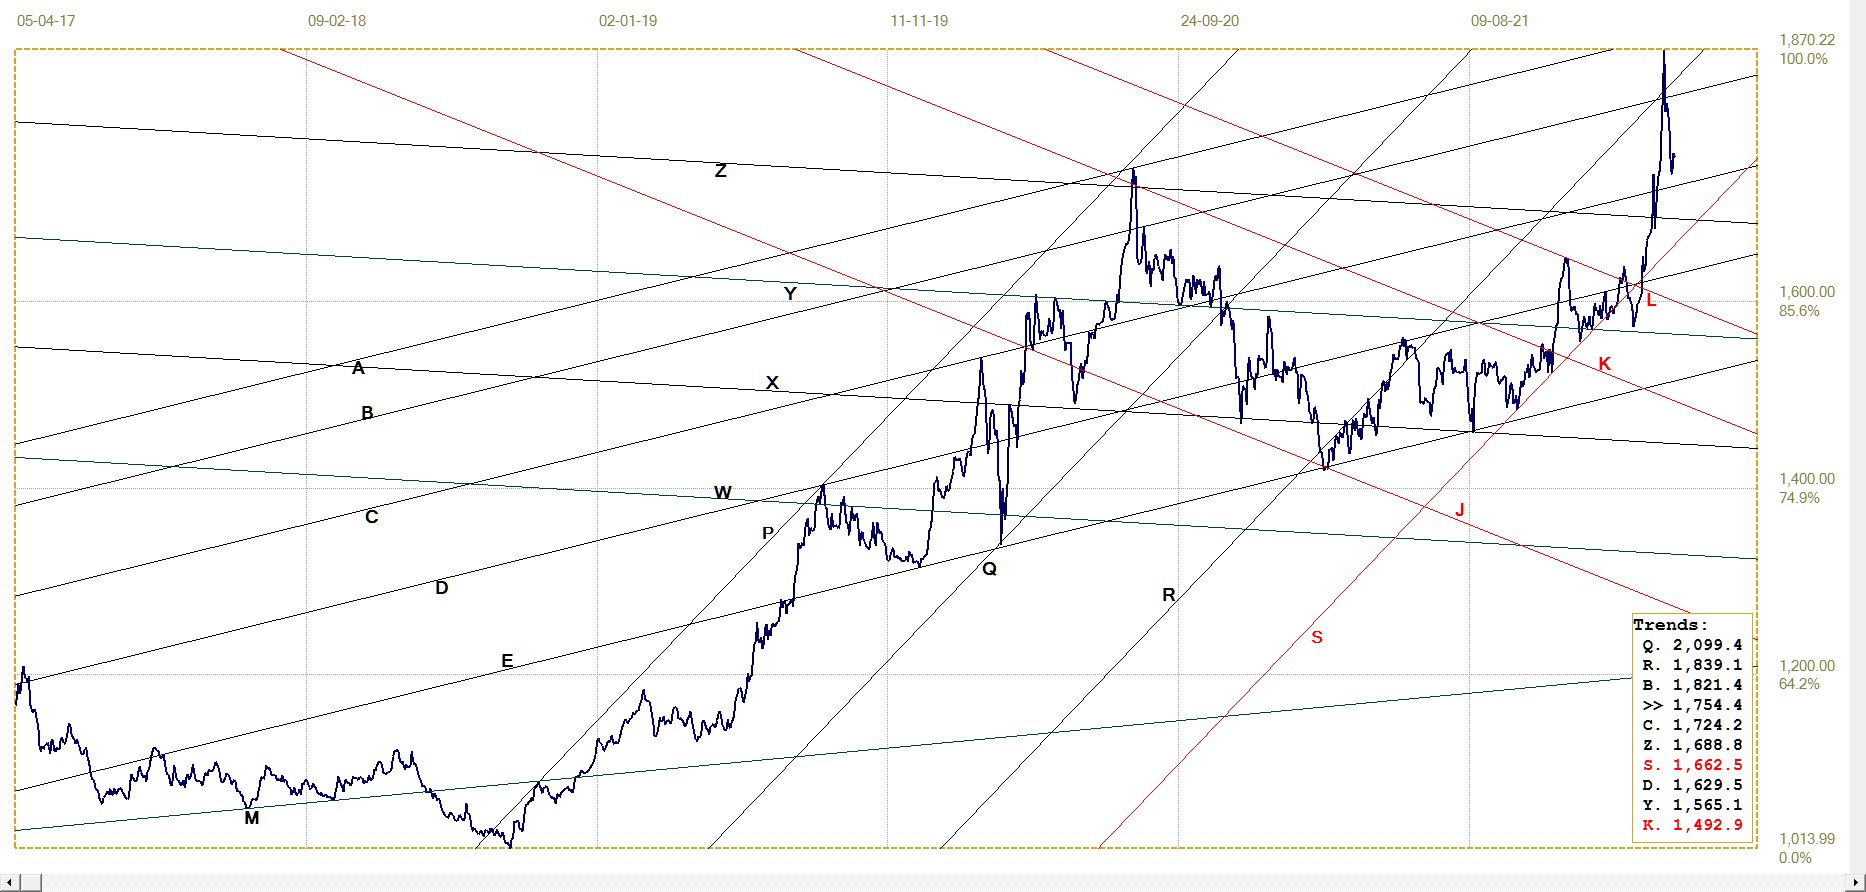
The Wall Street rally that carried the S&P500 to a break above its pennant resulted in a recovery into the top triangle above line F and minor break above the bear channel. A definite break above the channel is now needed to confirm the bullish break of the broader market. Bull channel JKL is effectively still intact to support a bullish bias for the stock market, but now a clear break higher is required for confirmation. It seems likely that profit taking – perhaps clearing the books from extra purchases on Triple Witch – could see the stock market lower on Monday and the coming week, which would place the trend back in bear channel XY, with a break below line F to confirm.
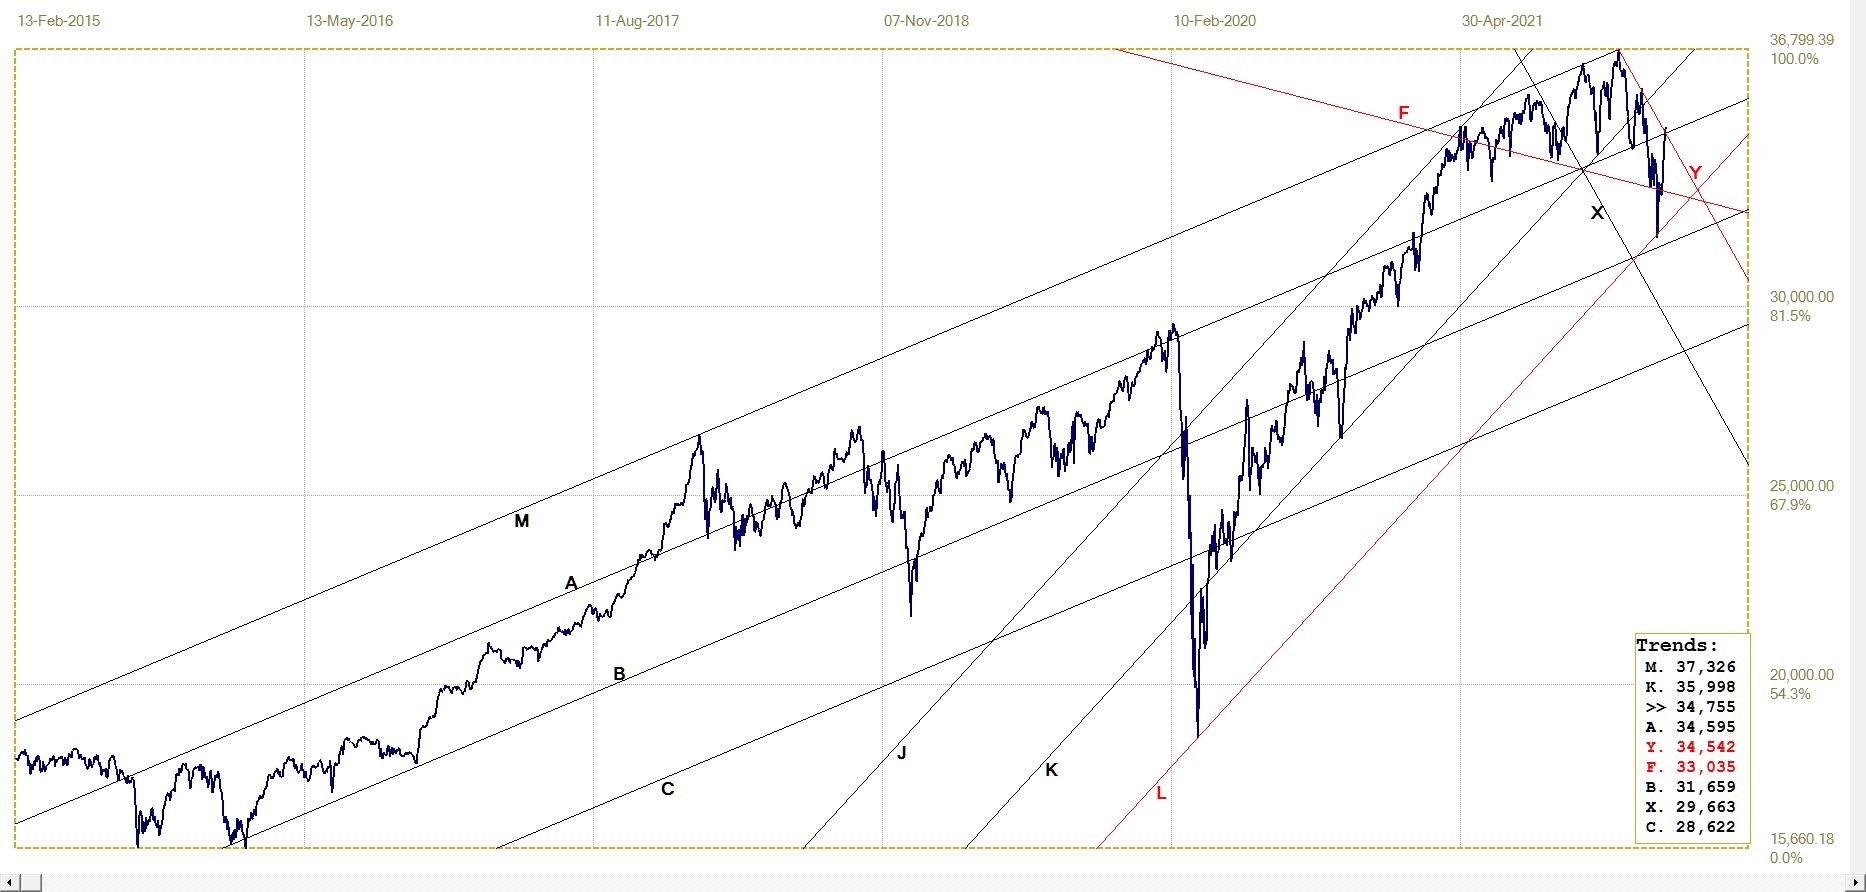
DJIA last = 34754.93 (money.cnn.com)
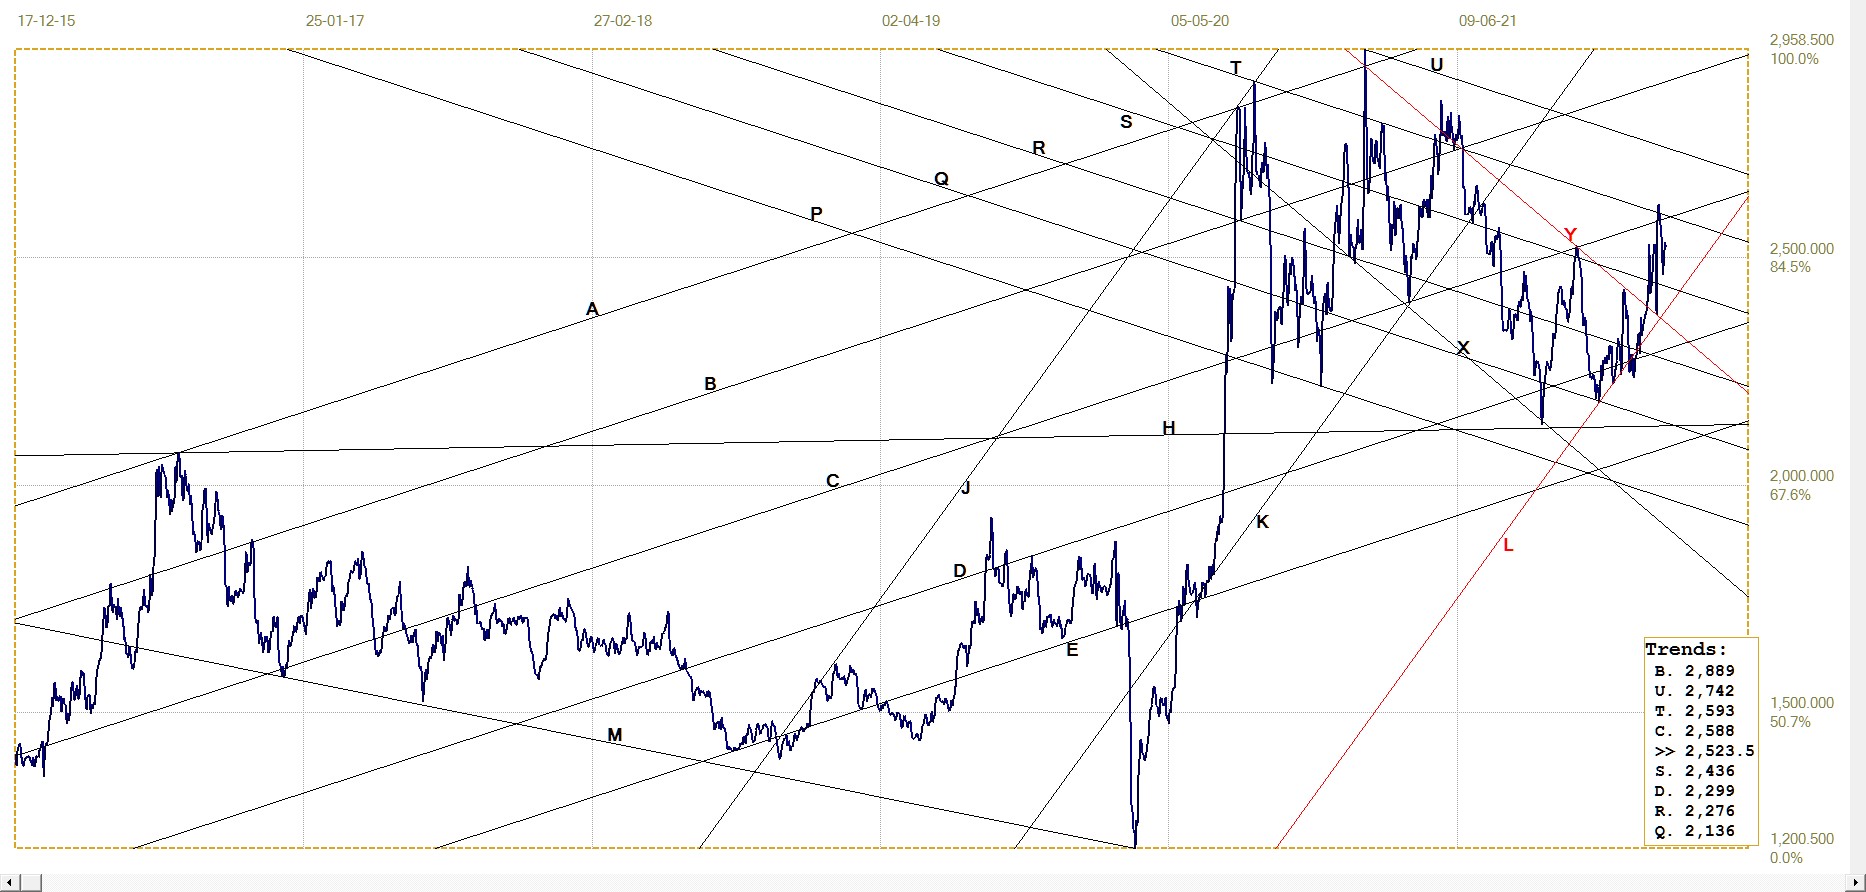
Gold London PM fix – Dollars
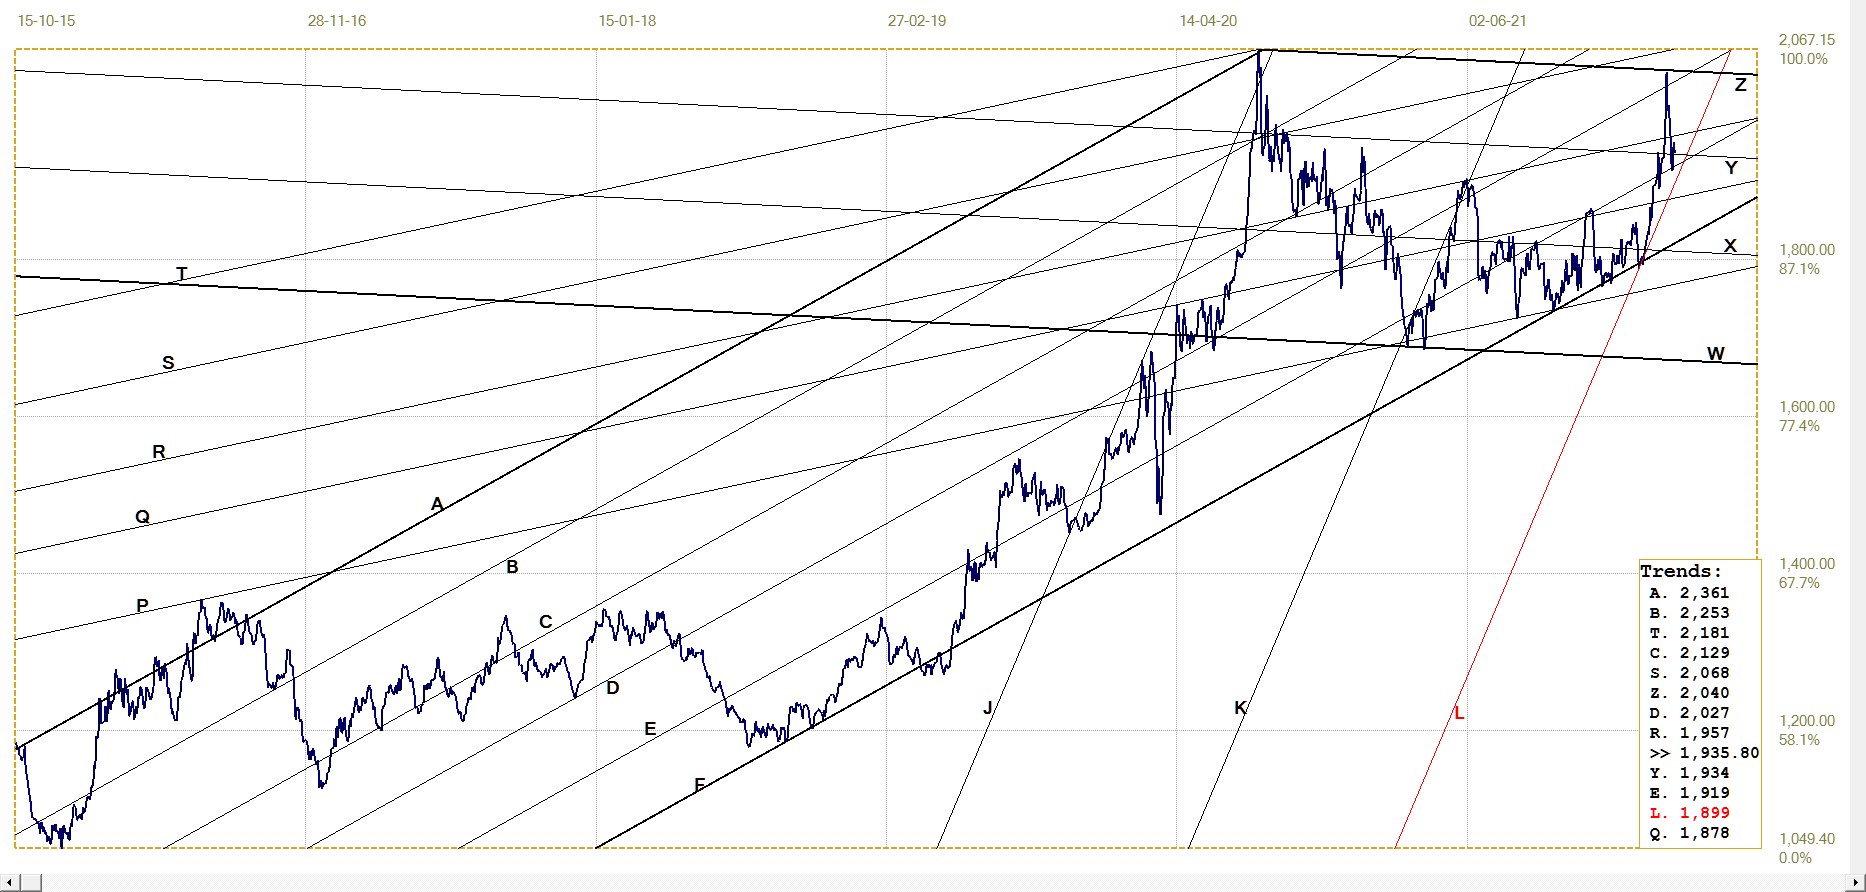
Gold price – London PM fix, last = $1935.80 (www.kitco.com)
It is beginning to look as if we again have to wait for the month of May to see a new rally in the price of gold. There is clearly more demand at play – as seems to be quite consistent over time despite the regular fleecing of bullish speculators – but this time it could be coupled to developments in eastern Europe. Not forgetting about Asia.
The possibility that Russia could require payment in gold for its oil and even natural gas, as hinted at by Putin, could present the US with a major problem – and break the price of the metals free from the decades long suppression. A sharp rise in the price of gold (and silver too) would be a near immediate reaction to such a decision, but the longer term problem would be the many petrodollars coming home as these are no longer needed to the same extent. A long term advantage for the US, exploited to the full, will become a liability with no easy solution as could be applied to Ghaddafi and Saddam when they showed intention to avoid use of the petrodollars.
Euro–gold PM fix
The weaker to steady dollar price of gold last week and the sudden spike in the value of the euro late last week took its toll on the euro price of gold, dragging it all the way lower close to the bottom of bull channel KL. If the channel can hold, it would imply that gold is moving higher again or that the euro spike higher has reversed. Europe is not as buffered against direct intervention from Russia as America is, so changes on the war front could have immediate impact on the euro and less so on the dollar, either way. Therefore a weaker euro again could be on the cards, while a stronger euro and weaker dollar would favour the dollar price of gold, more so if there also is an increase in global tensions at the time.
Euro gold price – PM fix in Euro. Last = €1754.42 (www.kitco.com)
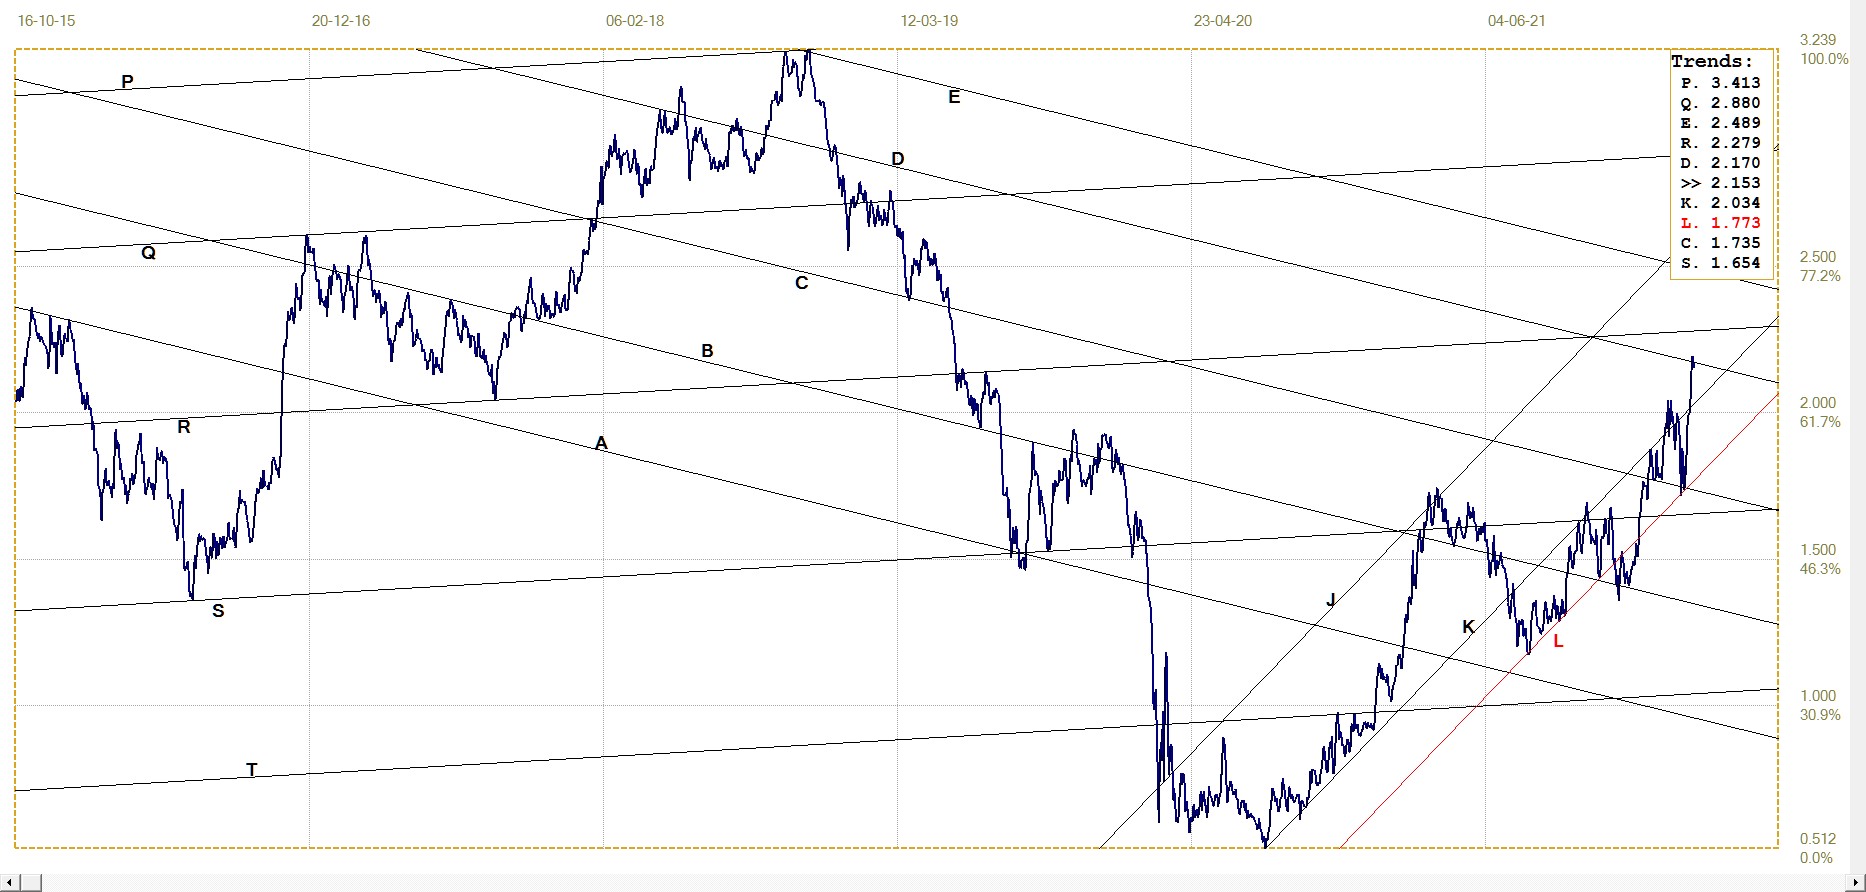
Silver price. Daily London Fix
Silver is as yet less in the direct sights of the current fluctuation in currencies and the price of gold, and as a result has acted less flamboyantly than dollar or euro gold. Yet the overall chart formation, firstly a broad bearish consolidation within the main bull channel ABCDE, and later the more volatile action as the price consolidated in bearish channel PQRSTU, shows that turmoil in the silver market is also increasing.
The spike below channel AE, down to line M in early 2020, said to neutralise an old and large option position, shows that the Big Banks are fully aware of all manner of threats to their positions in silver, whether of a short squeeze should their net short position get too large – vide the treatment of the Reddit Apes – or even when their profits come under pressure.
The brief foray above lines C and T was soon knocked back, but is holding above the next technical support along line C. A new move higher now, when allowed or forced, is thus more likely to be successful at the next challenge to the latest resistance.
We now have to wait for a clear break above channel PU to launch the price clear of strong resistance and to open the full range of channel JKL for its what lies ahead – after it had reached and successfully tested the top of shallower bull channel ABCDE.
Silver daily London fix, last = $25.235 (www.kitco.com)
U.S. 10–year Treasury Note
10–year Treasury note, last = 2.153% (Investing.com )
The kudzo analogy of last week appears to be coming into play. After holding below the 2% level quite stubbornly for some time – like a young child walking past the visitor holding her hand over her eyes on the premise of, ”If I cannot see you, you cannot see me,” the market tried to avoid ‘seeing’ higher inflation ahead. Now the ‘hand before the eyes’ has been removed and the yield jumped to well above 2% to reach line D in one move.
Interesting to see how often sudden sharp moves reach only as far as distinct support or resistance lines in these chart patterns – as if the price knew in advance that is as far as the move should go. It also happens when the price gradually creeps up to a trend line and then halts to hold there, but doing so with a steep and sudden move out of a consolidation pattern is more of a surprise.
West Texas Intermediate crude. Daily close
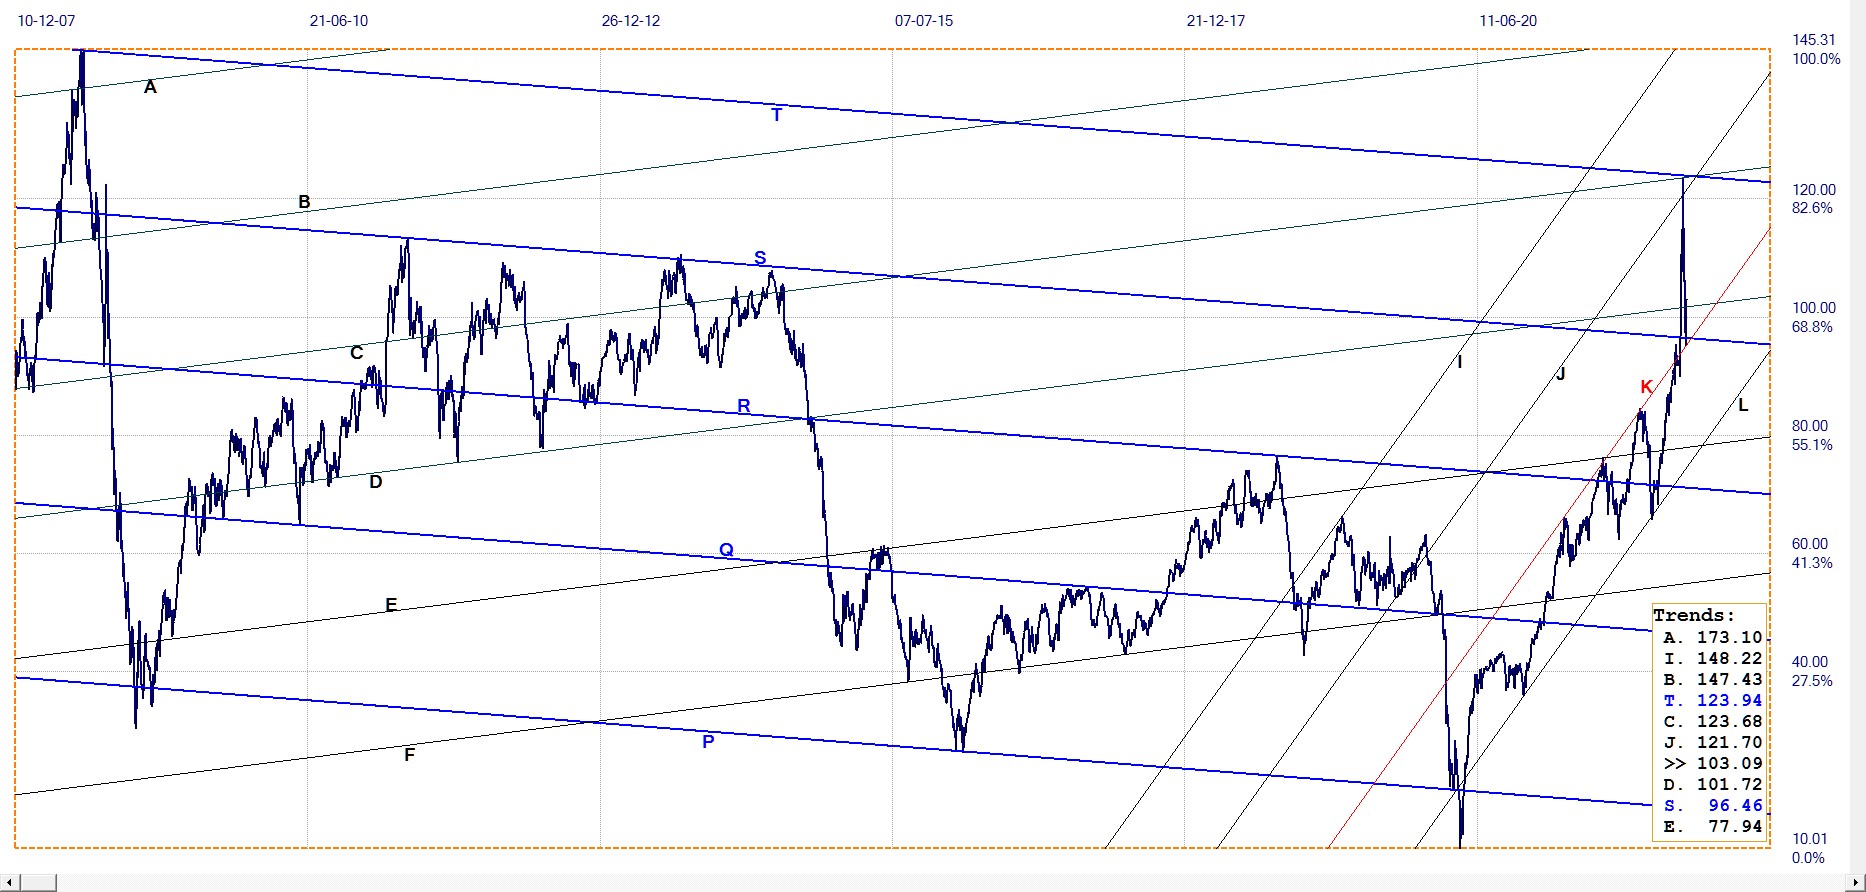
WTI crude – Daily close, last = $103.09 (www.investing.com)
Here is another example of such a steep move ending and reversing at key resistance, bearish channel PQRST has been in place for 15 years and contains the whole of the trend during that time, except for the abnormal and brief spike lower below line P into negative territory, which cannot be reflected in this TA software.
The break higher from channel KL into channel JK might also hold to indicate a bullish undertone in the price of crude, but even a break back into channel KL still has the potential to extend higher above broad channel TP without having to break from the bull channel.
And as mentioned before, last week saw the Ides of March pass without any major ructions, other than the anticipated quarter point increase in the rates. It nevertheless could be that when one looks back later, that small increase to recognise that inflation does present a problem, might be recognised as the watershed event that much later triggered a major recession or even depression. Not that events in Ukraine would not contribute, depending on the outcome, in a significant way to any significant changes in the global or national economies.
© 2022 daan joubert
*********


