Forecast: Gold Cycle And Technical Update


 Recapping The Action
Last week's trading saw gold forming its high in Tuesday's session, here doing so with the tag of the 1797.60 figure. From there, a sideways-to-down consolidation was seen into a Thursday low of 1774.60 - before bouncing slightly off the same into Friday, managing to end the week with a marginal net gain.
Gold Market, Short-Term
As noted in recent articles, the last short-term bottom came from our smallest-tracked wave, the 10-day cycle, which is shown again on the chart below:
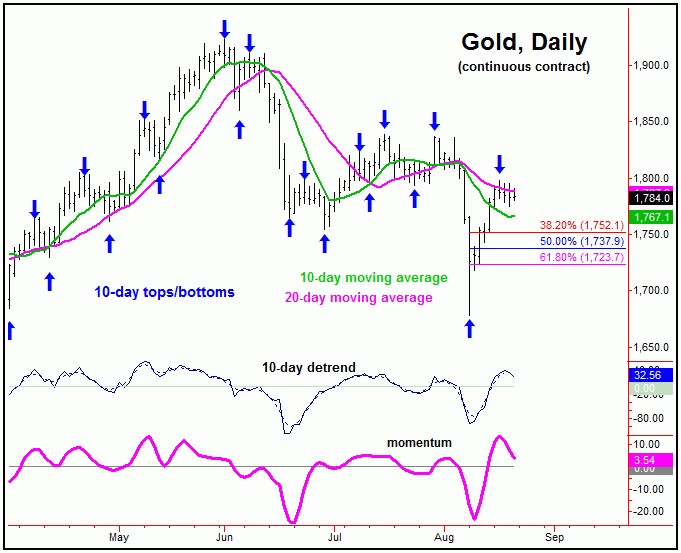
For the very short-term, it looks like the downward phase of the 10-day cycle is currently in force off the 1797.60 swing top, with this wave at some 9 trading days along - and with that looking for its next low to form again at anytime. In terms of price, however, the ideal path seems to favor additional retracement off the top, back to the 10-day moving average and/or into the 38-61% retracement of the prior swing up.
Stepping back slightly, with the 10-day moving average actually having turned up with the recent action, the probabilities now favor the upward phase of the larger 20-day cycle to be back in force. If this assessment is correct, then we should see additional upside in the next week or so (potential 1820-1830's), following the completion of the current correction phase with the smaller 10-day wave.
Gold's Stepped-Back View
As mentioned last weekend, gold's key dividing line is now the 1834.80 figure (December, 2021 contract) on a daily closing basis. This number could/should continue to drop going forward, but for now remains locked in place.
With the above said and noted, if the shorter-term rally phase (i.e., 20-day cycle) is going to end up as an immediate countertrend affair, then gold would be expected to remain below the 1834.80 figure on a daily closing basis. If it does, a drop back to or below the 1677.90 swing bottom would be expected into mid-to-late September.
So what would happen if gold were to close above that 1834.80 figure? If that were to instead be seen, then it would put the 1880-1900 region as the upside price magnet - even though that move would still be favored to hold below the 1923 swing top from back in June. This is due to the currently-viewed position of the larger 154-day component, shown again on the chart below:
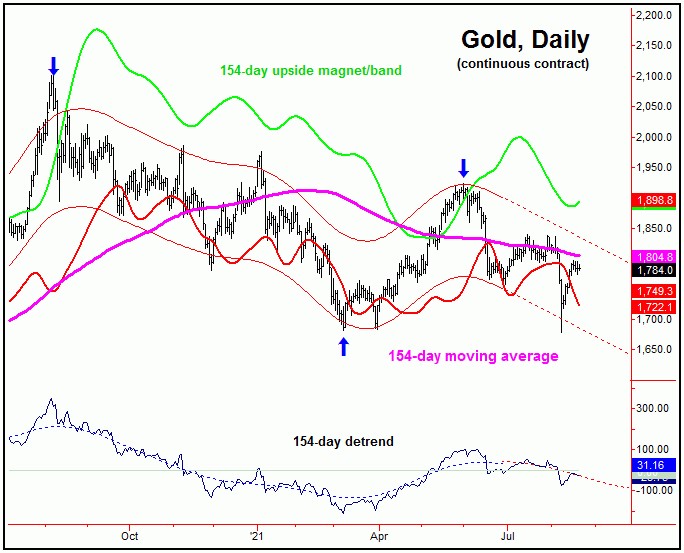
As mentioned in a prior article, taking out the June low of 1754.30 is now our best confirmation of a turn south with this 154-day cycle, which is projecting its next trough to occur around the October or November timeframe of this year.
With the above, the configuration of this 154-day wave tells us to expect any smaller- degree rally phase to end up as countertrend, ideally holding below the early-June peak of 1923.40. If correct, lower lows would be expected to play out into early- Autumn, before the next key bottom occurs for gold - with that bottom coming from this same 154-day component.
For the bigger picture, from whatever bottom that does form into the Autumn of this year, the probabilities will favor another decent percentage rally playing out into the Spring of 2022, as the next upward phase of the 154-day cycle re-assumes control.
Technical/Momentum Update
Seen as an overall technical negative is the configuration of our long-term momentum indicator for gold, which is shown on the chart below:
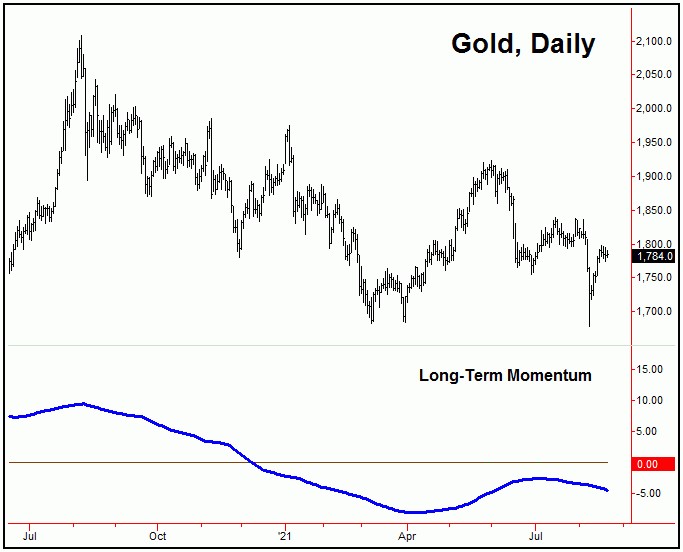
This particular indicator turned to the upside following the March bottom, and with that was viewed as supportive of the strength we saw into early-June. From there, there were indications of a top forming with the gold market, which gave way to the expected decline into late-June.
Of additional note is that our long-term momentum indicator never turned back to the upside following the late-June trough - and with that remains pointing south at the present time. This action tends to support the idea of additional weakness in the coming months (with the 154-day cycle), though - ideally - following another try at short-term strength between now and early- September.
We also keep a Mid-Term Breadth index for the gold market, which is shown on the next chart:
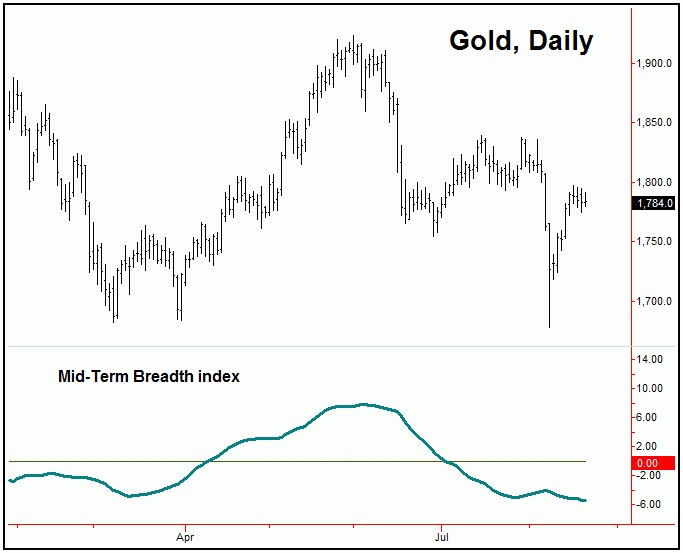
With the above said and noted, mid-term breadth is also pointing lower at the present time, with no particular divergence having formed - which is something we might expect to see at a larger low, such as with the 154-day cycle.
Even said, the ideal path is looking for short-term strength in the next week or so, with the upward phase of the smaller 10 and 20-day cycles. However, as mentioned, that action is favored to end up as a countertrend affair, giving way to weakness again into what is looking to be the early-Autumn period. Stay tuned.
Jim Curry
The Gold Wave Trader
http://goldwavetrader.com/
http://cyclewave.homestead.com/
********
More from Gold-Eagle


