Forecast: Gold Cycles Moving Back Into Bullish Mode


 Recapping Last Week
Last week's action saw the gold market holding weaker into Wednesday's Fed meeting, with the metal dropping all the way down to a low of 1753.00. From there, a sharp rally was seen to end the week, here pushing all the way up to a Friday high of 1815.70 - before backing slightly off the same into the daily/weekly close.
Gold Market, Short-Term
For the short-term view, the last good swing bottom has been expected to come from the 20-day cycle, which is shown again on the chart below:
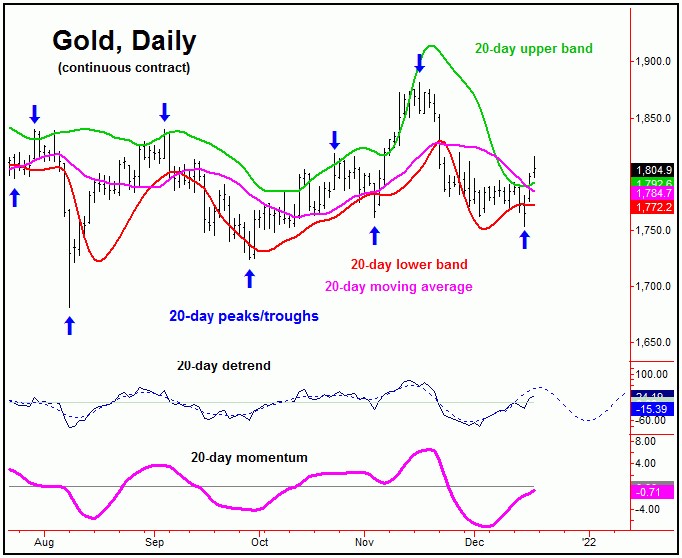
From last weekend: "In terms of price, gold needs to see a reversal back above the 1796.00 figure (February, 2022 contract) to actually trigger the next upward phase of this wave to be back in force, making this a key number to watch as we head into the new week. Otherwise, below the 1796.00 figure will keep the metal in a short-term bearish configuration."
From the comments made above, the last short-term bottom was due to materialize, with that low coming as a result of our 20-day cycle component. With that, the metal continued to drop to lower lows into Wednesday's fed day - before reversing sharply back to the upside into Thursday - in the process taking out our 1796.00 figure, thus confirming Wednesday's low as the last bottom for this wave.
With the above said and noted, the upward phase of the 20-day cycle (as well as a smaller tracked 10-day wave) is now deemed to be back in force, with the same at only 2 trading days along. This action should favor additional strength in the coming days, before the next minor peak attempts to form.
Gold's 72-Day Cycle
For the stepped-back picture, as mentioned in past articles, the bigger action is currently being dominated by our 72-day time cycle, which is shown again on the following chart:
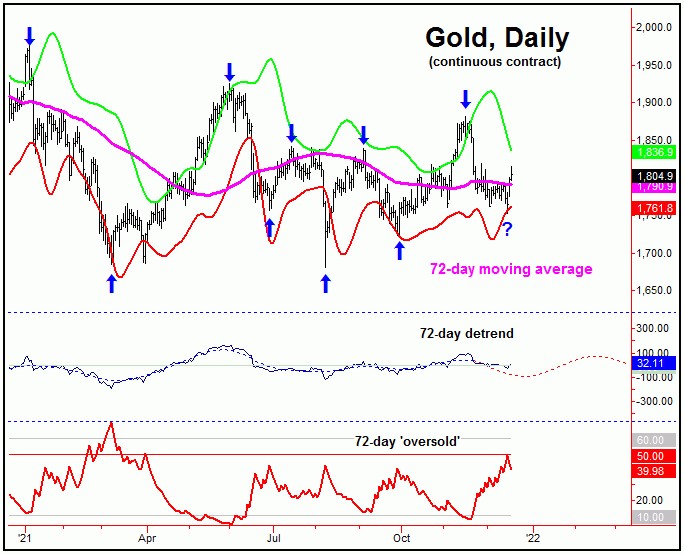
On our 72-day cycle chart, of particular note is that the last bout of weakness was able to see our 72-day 'oversold' indicator making a tag of its upper reference line - something we would expect to see on or before this wave troughs.
This 72-day 'oversold' indicator moves inversely to price action - similar to how the VIX moves in relation to the U.S. stock market. That is, drops below the lower reference line with this indicator are areas to be on the lookout for price peaks with this cycle, while moves above the upper reference line - if and when seen - are ideal spots to be looking for market bottoms to occur.
From last weekend: "In terms of price, the ideal path is looking for the current 72-day cycle downward phase is looking for a drop back to the lower 72-day cycle band, which is currently at the 1741 figure - but which is also moving daily."
As mentioned in past articles, the downside price 'magnet' to the recent correction phase with the aforementioned 72-day cycle was looking for a drop back to the lower 72-day cycle band. With last Wednesday's sharp intraday decline, a tag of this band has now been seen - and with that we can say that our normal expectation with this cycle was satisfied.
Even with the likelihood of a trough in place with the 72-day cycle, it is still a bit early to confirm. In terms of price, we have a key price level, which - if closed back above - will be the trigger for the next upward phase of this 72-day wave, with exact details noted in our thrice-weekly Gold Wave Trader market report.
Stepping back, the overall path is looking for the next upward phase of the 72-day cycle - once confirmed to be in force - to last into the mid-January to mid-February timeframe of next year. In terms of patterns, until proven otherwise, that move up is favored to end up as a countertrend affair - holding below the 1882.10 swing top, though a complete re-test of the same could easily be seen.
The Bottom Line
The bottom line with the above has been looking for weakness into the mid-December timeframe to play out, coming from our 72-day time cycle. The next key low was also due to materialize with this same wave, which is expected to see a sharp rally into early next year - before the next key top attempts to form. From there, we are looking for another sizeable decline into late-Spring or early-Summer of 2022, to complete the downward phase of the larger-degree cycles that we track. Stay tuned.
Jim Curry
The Gold Wave Trader
http://goldwavetrader.com/
http://cyclewave.homestead.com/
**********


