Forecast: Gold Prices Consolidating Before Final Run Higher


 Recapping Last Week
Last week's action saw Gold forming its high in Tuesday's session, here doing so with the tag of the 1879.50 figure. From there, the metal turned weaker into late-week, here dropping down to a Friday low of 1844.20 - before bouncing just slightly off the same into the daily/weekly close.
Gold Market, Short-Term
Taking a look at the short-term picture for gold, the recent decline comes as a result of the smallest cycle that we track, the 10-day wave - which is shown below:
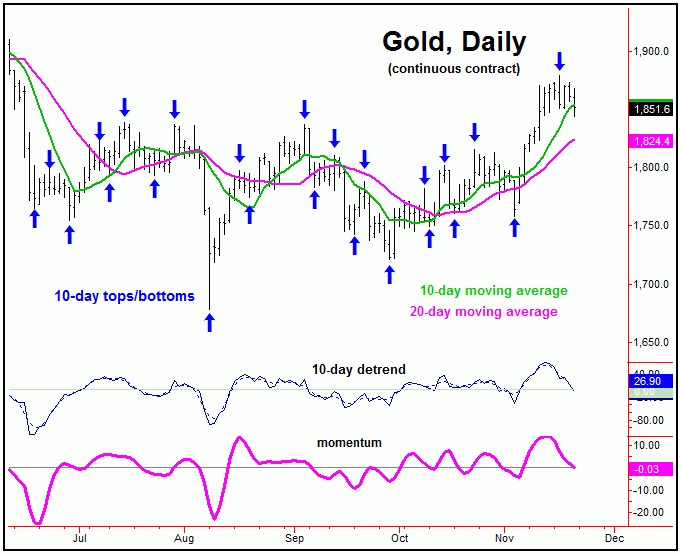
The most recent upward phase of this 10-day wave was strongly translated to the right, with its peak coming in at the 9 trading day mark. This action will normally favor the decline off the top to end up as a countertrend affair, giving way to higher highs for the larger swing up, upon completion.
Support to the current swing down with the 10-day cycle, if tested, will be the 1818-1832 region for Gold. This range encompasses the 38-50% retracement of the prior swing up, from the 1758 low to the 1879 peak.
In terms of time, the next rally phase of this 10-day cycle - once back in force - is favored to last into later this month, before the next peak of bigger significance is seen, coming from the larger 72-day cycle, which is shown again on the chart below:
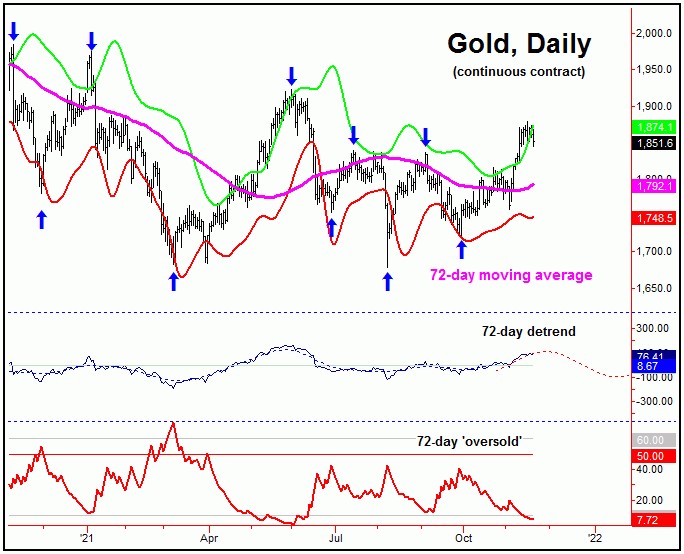
From the comments made in past articles, this 72-day cycle has been projected higher into the late-November timeframe, with the next peak of significance expected to come from this particular wave. With that, the ideal path - as mentioned earlier - is looking for the shorter-term decline phase (with the 10-day cycle) to end up as a countertrend affair, with support into the 38-50% retracement zone.
Stepping back then, a countertrend decline with the 10-day wave - if seen as expected - should give way to a spike back above the 1879.50 swing high into later this month. If seen, that move would be the odds-on favorite to top the aforementioned 72-day cycle, for what is expected to be a fairly decent decline into December.
In terms of price, it is too early to confirm the next downside reversal level for the 72-day cycle, though one should ideally materialize in the coming days - depending on the action. Resistance to the current upward phase of this wave has been noted at or into the 1895-1925 region (December, 2021 contract) for gold, thus making this zone a key level to watch going forward, should it be attempted.
Stepping back then, once the next 72-day cycle peak is in place, gold should see a decent correction into December timeframe, with more precise details of how this decline is expected to play out, noted in our thrice-weekly Gold Wave Trader report.
In terms of patterns, due to the configuration of a larger 154-day wave that we track, we are favoring this decline to end up as a larger countertrend affair. Here again is that 154-day cycle component:

As can be seen on the above chart, our 154-day cycle is ideally projected higher into early next year. If this assessment is correct, a December bottom with the smaller 72-day wave would be expected to give way to higher highs on its next upward phase, which would likely take us into January or February of 2022.
For the bigger picture, higher highs into early next year - if seen as expected - should top this 154-day cycle. From there, a larger percentage decline is expected to play out in the weeks to follow, with the next 154-day trough due sometime around late-Spring of 2022. In terms of price, it is too early to suggest how that decline will play out, though we should have a better idea as we move along.
The Bottom Line
The bottom line with the above is that the recent short-term decline is favored to end up as a countertrend affair, giving way to higher highs, upon completion. From there, the next peak of significance should form, coming from the larger 72-day wave - which is next due to trough in the month of December. That move is also favored to end up as a countertrend affair, before giving way to higher highs again into early next year. More on all as we continue to move forward.
Jim Curry
The Gold Wave Trader
http://goldwavetrader.com/
http://cyclewave.homestead.com/
********


