Forecast: What's Next for Gold


 Recapping Last week
Gold prices saw the high for last week registered in Monday's session, here doing so with the tag of the 1842.80 figure. From there, a sharp decline was seen into late week, with the metal dropping all the way down to a Friday low of 1783.40 - before bouncing off the same into the daily/weekly close.
Gold Market, Short-Term
For the very short-term, the downward phase of the 10-day cycle is still deemed to be in force, with the same now at 13 trading days along from its last labeled low, with this wave shown again on the chart below:
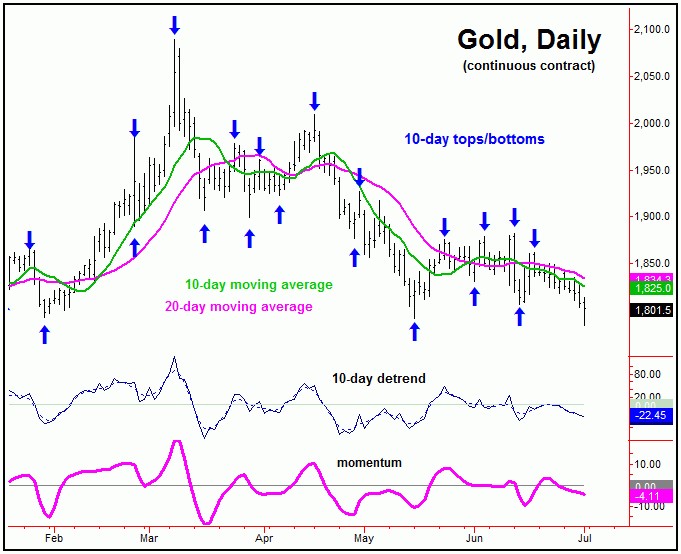
As mentioned last weekend, the next smaller-degree bottom is expected to come from this same 10-day wave. In terms of price, any reversal back above the 1815.10 figure (August, 2022 contract) - if seen at any point - would be our best indication of a turn higher with the same, thus making this a key level heading into the new week.
Otherwise, holding below the aforementioned 1815.10 figure will keep the downward phase of this 10-day wave intact, still with the potential for lower lows before it bottoms. Going further, this upside reversal point of 1815.10 could continue to drop going forward - depending on the action - with the most up-to-date numbers always noted in our thrice-weekly Gold Wave Trader report.
Gold's Stepped-Back View
Stepping back slightly, as noted in recent months, the bigger rally phase came from our larger 72-day cycle, which last bottomed out with the mid-May tag of the 1791.20 figure. Here again is that 72-day component:
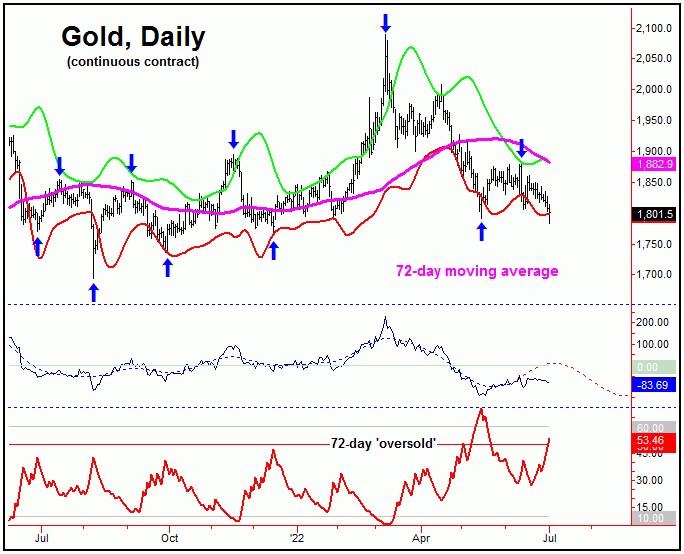
In terms of price, there were two upside targets for the recent rally phase of this 72-day cycle. The first was to the upper 72-day cycle band (bright green), and which ended up being met with the June 13th spike up to the 1882.50 figure.
The second target was back to the 72-day moving average for Gold - which was not hit during the most recent upward phase of this wave. This action is an anomaly, since 85% of the upward phases of this 72-day cycle will see a reversion back to this key moving average. This particular setup has been true throughout the up-and-down phases of this 72-day wave, going back many decades.
Having said the above, with Friday's break below the 1791.20 figure, this 72-day cycle had to have topped out with the 1882.50 swing high - made at this upper 72-day cycle band. With that, the metal is likely heading on down into a much larger-degree low, now expected to come from the 310-day cycle, and shown again on the chart below:
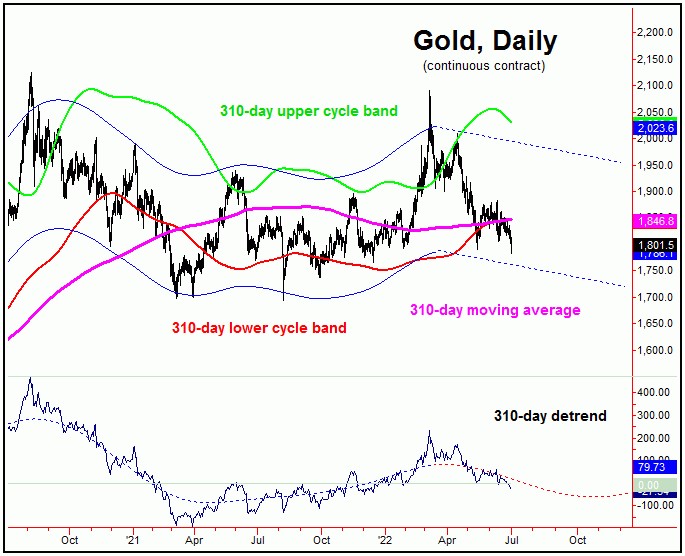
In terms of time, the next trough for this bigger 310-day component is projected for the Autumn of this year (October, plus or minus). From whatever low that does form with this wave, the probabilities will favor a larger-degree rally of some 20-25% or more playing out into May of 2023 or later. This 20-25% rally range is the average statistical zone for the upward phases of this 310-day cycle.
With the above said and noted, the most recent swing high of 1882.50 now becomes a key dividing line going forward. That is, any push above that figure - if seen at any point - would be our indication of a 310-day cycle bottom set in place.
This 1882.50 figure is also the 'trigger' for the aforementioned rally of 20-25% or more, as the next upward phase of this 310-day wave assumes control, following an Autumn bottom. This 1882.50 figure is obviously well above current prices, though is a number which should continue to drop, as we move along.
For the in-between view, even with the confirmed turn south with the 72-day cycle, we could be at or nearing a short-term bottom for Gold; it could even have formed in Friday's session. That is, a confirmed turn with one cycle will often see an immediate reversal in the opposite direction - normally coming from a wave of the next smaller-degree degree.
With the above, this means a nice short-term rally should soon develop with the smaller 10 and 20-day cycles, though we would now expect that rally to end up as a countertrend affair - holding below the 1882.50 swing top. From there, a push back to lower lows for the bigger 310-day cycle downward phase into the Autumn months, before the next mid-term trough forms for the metal. Stay tuned.
Jim Curry
The Gold Wave Trader
http://goldwavetrader.com/
http://cyclewave.homestead.com/
*********
More from Gold-Eagle


