Fractal Analysis Shows Coming 70s Style Gold Stocks Rally From Even Cheaper Levels


In terms of the gold price, gold stocks are currently at better value than at the beginning of the bull market in 2001. At the bottom of the gold bull market in 2001, the XAU to Gold ratio was around 0.2 compared to 0.05 today. In other words, gold stocks are cheaper than they were in 2001. In fact, they are cheaper than they have been the last 78 years at least.
If you are confident that the gold bull market is about to continue, and trust gold stocks as the best “vehicle” to take advantage of the gold bull market, then it is probably an ideal time to get into these gold stocks.
Based, on the last hundred years, I would guess that you have about a 50% chance of being correct, about gold stocks outperforming gold. Why? During the Great Depression era, gold stocks outperformed gold, whereas during the 70s gold bull market, gold actually outperformed gold stocks (on average).
However, I do believe that this time gold stocks could actually outperform gold (like during the Great Depression), by the time this bull market is over, but this issue is for another day (detailed analysis in my Gold Mining Fractal Analysis Report).
Today, I would like to show how the structure of the current gold stocks market (since about 2001) is very similar to the gold stocks bull market of the 70s. In fact, it is similar in the same way that the current silver bull market is like the 70s silver bull market.
Below, is my fractal analysis comparison (using the Barron's Gold Mining Index (BGMI)) of the current gold stocks market and the 70s gold stocks market:
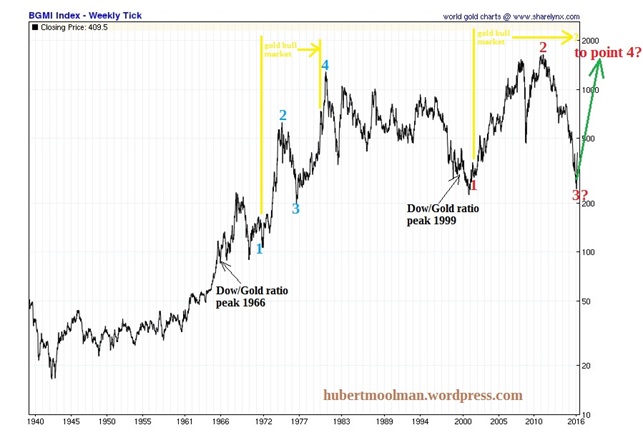
(chart is from sharelynx.com)
On the chart, I have marked two patterns from 1 to 4. Both patterns started after a major top in the Dow/Gold ratio. They both started at point 1 where the gold price started rising (1971 and 2001 respectively). Point 2 on both patterns represents the first major peak of the BGMI index, which roughly coincides with the relevant interim gold peak (1974 and 2011 respectively).
Point 3 is the bottom after the first interim peak of the BGMI index, from where price went to the ultimate peak at point 4 (which came in just after the 1980 gold price peak). It is also interesting to note that the Dow actually made an important peak in 1976 close to point 3,which appears to be similar to the May 2015 Dow peak (which is of course close to the current point 3).
It, therefore, appears that we are currently just about after point 3, with the chunk of a massive gold stocks rally ahead. If it continues to follow the 70s structure, then we could see a peak in gold stocks after a gold price top.
Will this gold stocks rally outperform the gold price like during the Great Depression era? For more on this and this kind of analysis, you are welcome to subscribe to my premium service. I have also recently completed a Gold Mining Fractal Analysis Report.


