GDX Technical Analysis


The Market Vectors Gold Miners ETF (GDX) is an equity index that provides exposure to small, medium and large sized companies that generate most of their revenues from gold and/or silver mining. It is listed on the American Stock Exchange (AMEX) with price last trading at $22.45.
Let’s take a top down approach beginning with the monthly chart.
GDX MONTHLY CHART
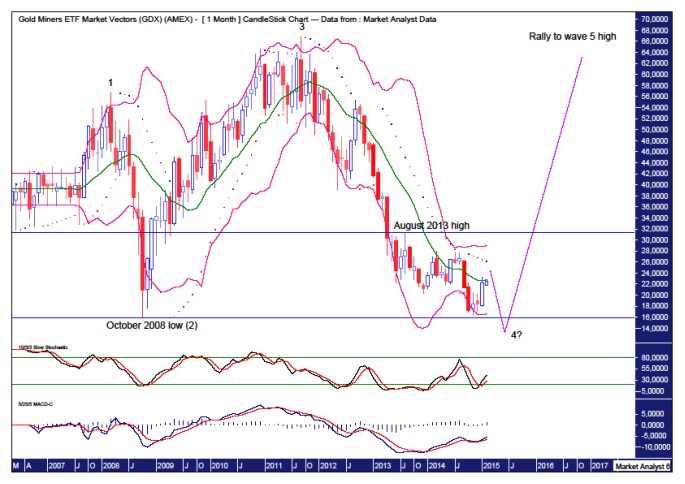
There looks to be a big 5 point broadening top pattern in play denoted by the numbers 1, 2, 3, 4 and 5. Price still looks to be tracing out the point 4 low.
Price has recently rallied from its lows which looks to have set up a double bottom. Double bottoms generally don’t end downtrends so after this rally I expect price to come back down and bust the double bottom and puts in the final low.
The Stochastic indicator is bullish but in weak territory.
The Moving Average Convergence Divergence (MACD) indicator is trending up and looking bullish. Any move back down to new lows may set up bullish divergences. In fact, the recent low was accompanied by a bullish divergence.
As for where the rally may end, I have added Bollinger bands which show price moving away from the lower band and now at the middle band. The upper band is a valid target and that stands just under $29 currently.
The Parabolic Stop and Reverse (PSAR) indicator is showing a bearish bias and the resistance given by the dots on the upside may halt this rally. These dots are currently at $26.20. However, considering this is a corrective phase playing out it would not surprise to see these dots taken out as part of some choppy corrective price action. Let’s see.
This rally should not surpass the August 2013 high at $31.35. Doing so would likely indicator the bear trend is over.
GDX WEEKLY CHART
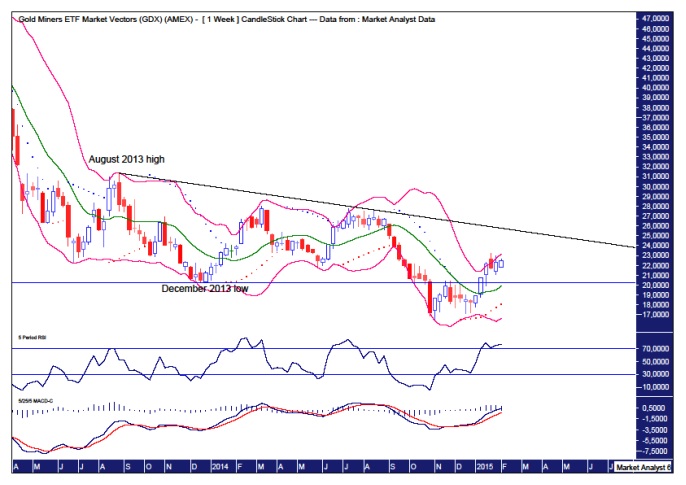
I have drawn a horizontal line to denote the December 2013 low. This was the previous major swing low and price recovering above that level is bullish.
The PSAR indicator has a bullish bias but it wouldn’t surprise to see price come back down to test these dots. There has already been a test of this support which held. A second test would likely not pull back so deeply.
The Bollinger Bands show price has made its way from the lower band to the upper band. I’d like to see price come back down and find support around the middle band which is currently just below $20.
The Relative Strength Indicator (RSI) is looking strong but is overbought so a little correction looks in order.
The MACD indicator is trending up nicely in bullish fashion. Any correction should do too much damage here in my opinion.
I have drawn a black downtrend line from the August 2013 high and price may find resistance here if and when it makes it up there. Time will tell.
GDX DAILY CHART
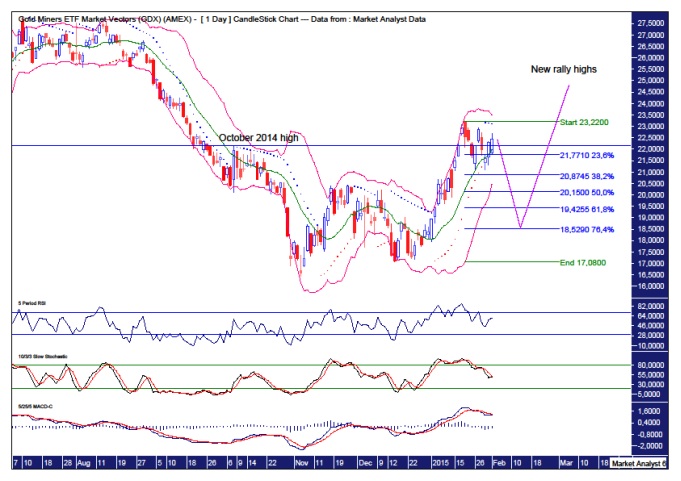
Price has recently taken out and previous major swing high set in October 2014 so a higher high will be put in place if it isn’t already.
The Bollinger Bands show price has moved away from the upper band and now resides at the middle band. There is the potential for price to head back up to the upper band but I suspect not. On the contrary, I believe price will shortly make its way to the lower band as the corrections takes centre stage. Why?
The PSAR indicator now has a bearish bias after price busted the dots on the downside a few days ago.
Also, the lower indicators, the RSI, Stochastic and MACD, are all now trending down and looking relatively bearish.
As for where any correction may end, I have added Fibonacci retracement levels of the move up from recent low to recent high. I favour price correcting back to the 76.4% level at $18.52. The 61.8% level at $19.42 is another level to watch closely.
After that correction, I expect price to move up to new and final rally highs.
Then, the move to final bear market lows can take place with a view to put an end to the bulls’ misery.
********
Disclosure – I have no financial interest in GDX.
My website is www.thevoodooanalyst.com
© 2014 Copyright The Voodoo Analyst - All Rights Reserved
Disclaimer: The above is a matter of opinion provided for general information purposes only and is not intended as investment advice. Information and analysis above are derived from sources and utilising methods believed to be reliable, but we cannot accept responsibility for any losses you may incur as a result of this analysis. Individuals should consult with their personal financial advisors. Put simply, it is JUST MY OPINION.


