GDXJ Update…A Diamond In The Rough


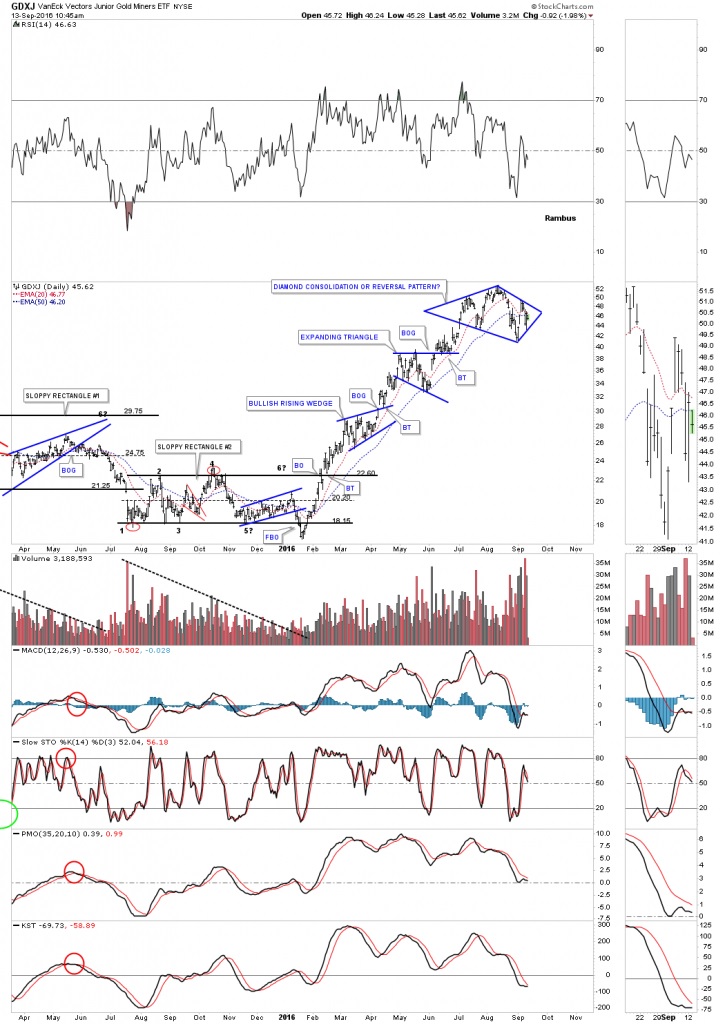
It wasn’t until yesterday that I could draw in a possible bottom rail of a possible diamond pattern on the GDXJ. This potential diamond pattern has been forming since the first of July. As it stands right now the diamond pattern has completed five reversal points which theoretically puts it into a reversal pattern category. With that said the bounce yesterday may have started the all-important 6th reversal point to the upside which if completed would make this diamond a consolidation pattern to the upside. Keep in mind this potential diamond is still developing with no resolution either way yet.

This next daily chart for the GDXJ is a longer term daily look which shows the sloppy 5 point rectangle reversal pattern which formed at the bear market low. The false breakout through the bottom rail of the 5 point rectangle reversal pattern was the shakeout before the breakout. So far this first new leg up of the bull market is picture perfect with one consolidation pattern forming on top of the next. At some point the last pattern to form before we get a decent correction will be a reversal pattern and not a consolidation pattern. It’s not unusual to see a string of three or four consolidation patterns form within a strong impulse move. The diamond at the top of the chart will most likely tell us the direction of the next important move for the GDXJ and the rest of the PM complex.
Below is a daily line chart for a slightly different perspective. Note how the bullish rising wedge formed below the support and resistance zone and the expanding triangle above which is one way to take out overhead resistance.

This weekly chart puts everything in perspective. The diamond pattern is forming right in the heart of overhead resistance going all the way back to the 2013 breakout gap to the downside ping ponging between the two S&R lines.
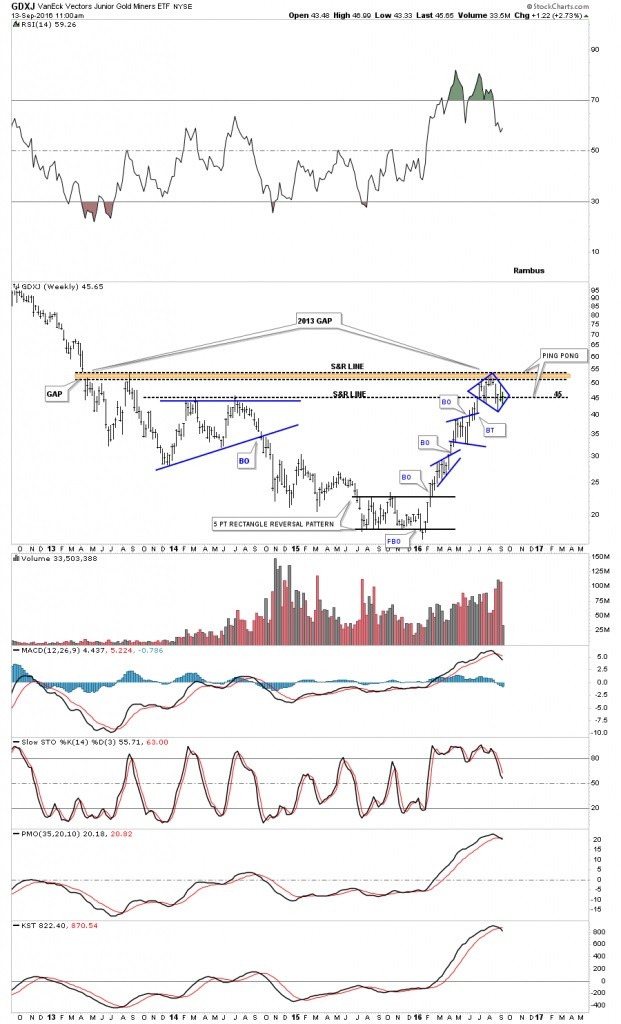
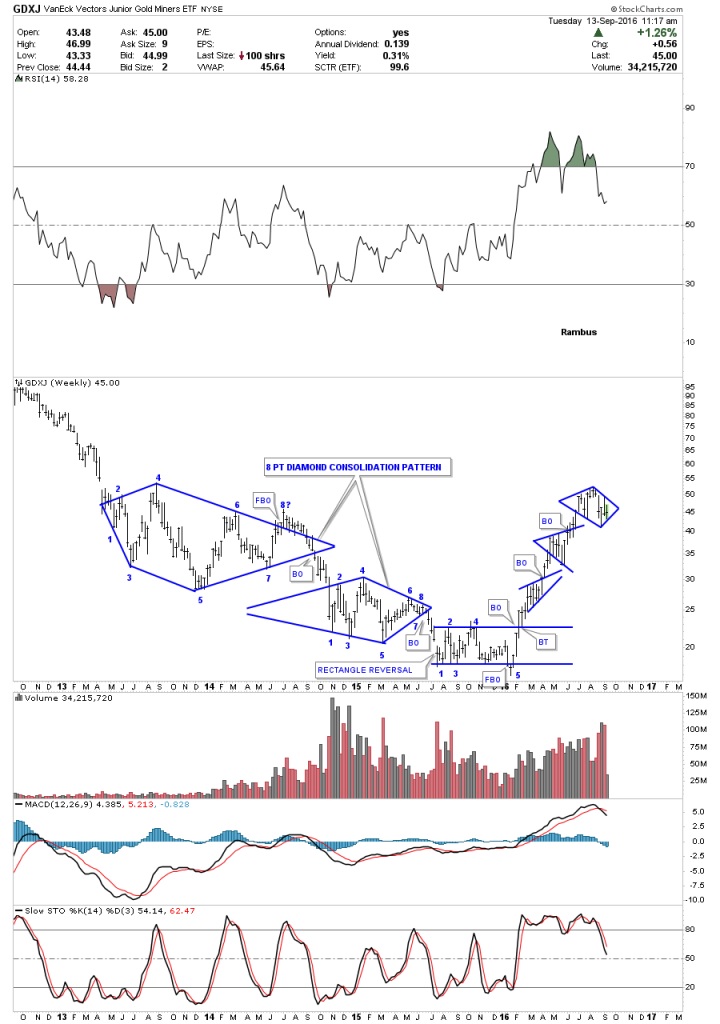
Some of our long-term members may remember some the diamond consolidation patterns that formed during the bear market years that seemed to take forever to complete. Some were not that pretty and had a false breakout above the top rail like the GDXJ. I believe the $XAU ended up with the most symmetrical diamond consolidation pattern of all the PM stock indexes. This weekly chart for the GDXJ shows the end of the bear market and the beginning of the new bull market with the five point rectangle reversal pattern reversing the bear market. Our current diamond pattern is going to tell us if the next move is going to be to the upside or we get our first real correction. Stay tuned as things are getting interesting in this red hot sector.
 Meet Rambus, a seasoned trader and technical analyst renowned for his unbiased and insightful chart work. Through his website, Rambus Chartology, and Substack newsletter, Rambus shares his expertise with a global community of subscribers, providing daily updates, commentaries, and hands-on training in the art and science of chartology. With his calm, humble, and down-to-earth approach, Rambus demystifies complex market trends, helping his followers navigate the challenges of today's volatile markets. Join the Rambus Chartology community today and discover a unique blend of technical analysis, trading expertise, and time-tested protocols. Subscribe now at www.rambus1.com or https://rambuschartology.substack.com/


