Global Debt Increase 2018 vs Gold Investment Must See Charts


Global debt increased at the fastest rate at the beginning of 2018. In just one quarter, total global debt jumped by more than $8 trillion. That is quite surprising as total world debt rose by $22 trillion for the full year in 2017. Thus, the increase in global debt last year averaged $5.5 trillion each quarter.
However, global debt according to the Institute of International Finance dropped by $1.5 trillion in the second quarter of 2018. While mature markets saw their debt decline in Q2 2018, emerging market debt increased by $1 trillion lead by China. In looking at the data from the Institute of International Finance (IIF), they stated that global debt jumped by over $8 trillion in the first quarter of 2018 to $247 trillion, but then declined $1.5 trillion to $247 trillion in Q2 2018.
So, the global debt must have jumped by $9.5 trillion to $248.5 trillion during the first quarter of 2018 and then dropped $1.5 trillion in Q2. Thus, the IIF must be revising their figures each quarter. Either way, the net increase in global debt in the first half of 2018 was $8 trillion.
If we look at the following chart below, we can see how the increase in global debt compares to the value of the total global gold investment as well as the value of world gold supply:
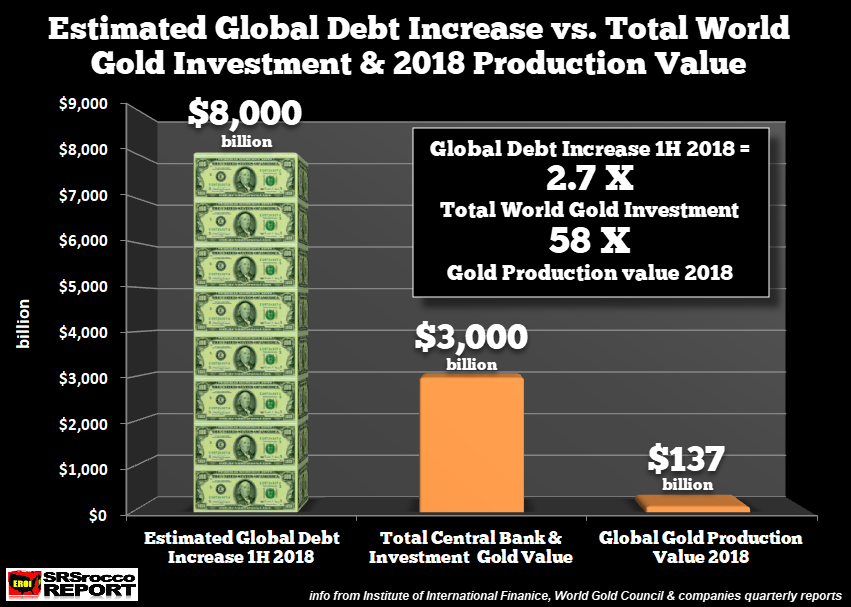
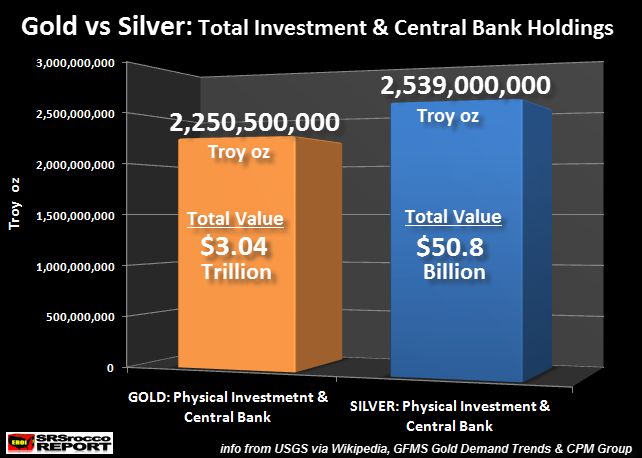
From my research, total world gold investment, Central bank and private investment total approximately $3 trillion. This is based on the data from the next chart that estimates global gold investment of 2.25 billion oz valued at a $3 trillion:
Interestingly, when I did the chart above earlier this year, the market price of gold was trading at $1,330. Today, it is $100 less. So, if I want to be totally accurate, total Central bank and private gold holdings are presently valued at $2.8 trillion. Regardless, global debt increased $8 trillion in the first half of 2018, more than 2.5 times than the value of all world investment gold holdings.
Furthermore, total global gold production I forecast will reach 3,375 metric tons this year (108.5 million oz), going by the World Gold Council’s Q3 2018 Gold Demand Trends, worth a total value of $137 billion (shown in the first chart above). Which means, the increase of global debt in the first half of 2018 was 58 times greater than the value of world gold production this year.
The ability of Central banks to print money and add debt has impacted the value of most stocks, bonds, and real estate. Thus, we have experienced massive “ASSET PRICE INFLATION” rather than “CONSUMER PRICE INFLATION.” Simply put, Central bank monetary policy has mostly benefited those who invest in stocks, bonds, and real estate.
Unfortunately for most investors, the present economic cycle is 10 years long, getting ready for a massive correction lower.
Physical Gold Investment Demand Jumps Q3 2018 While Retail Investors Shun Gold ETFs
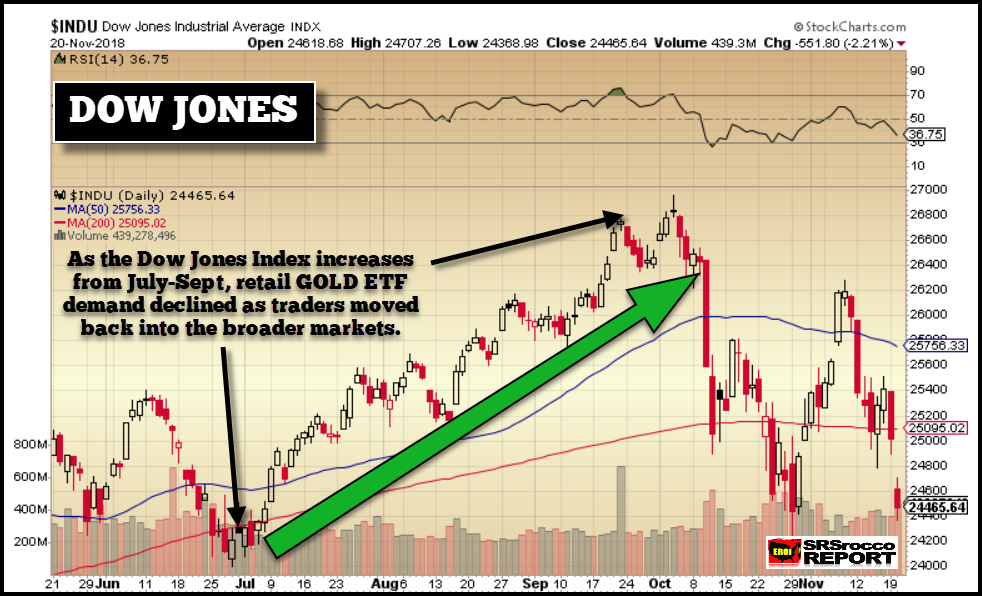
Quite expectedly, retail investors shunned Gold ETF’s and moved back into stocks as the broader markets rallied in the third quarter of 2018. After the Dow Jones Index fell to 24,000 in June, down from a high of 26,500 in January, it added another 2,750 points during the quarter reaching a new record high of 26,750 in September.
According to the World Gold Council Q3 2018 Demand Trends, Gold ETF’s liquidated 103 metric tons during the third quarter as the broader markets rallied:
However, the World Gold Council stated that physical gold investment jumped 27% in Q3 2018 to 211 metric tons (mt) versus 165 mt in the same quarter last year. Furthermore, physical gold investment demand in the third quarter of 2018 was 17% higher than Q2 of 180 mt.
So, while the retail investor is still BAMBOOZLED by Central bank asset price inflation, physical gold investors continue to purchase a significant amount of the metal as it is one of the only safe havens available in the market to protect wealth. And let me tell you, the time will come when retail investors wished they had purchased some “SAFE HAVEN GOLD” at much lower prices after the markets crashed.
As I mentioned at the beginning of the article, total gold annual production in 2018 is currently valued at $137 billion (based on $1,220 gold price). Now, compare this to the value of global silver production this year of $14 billion:
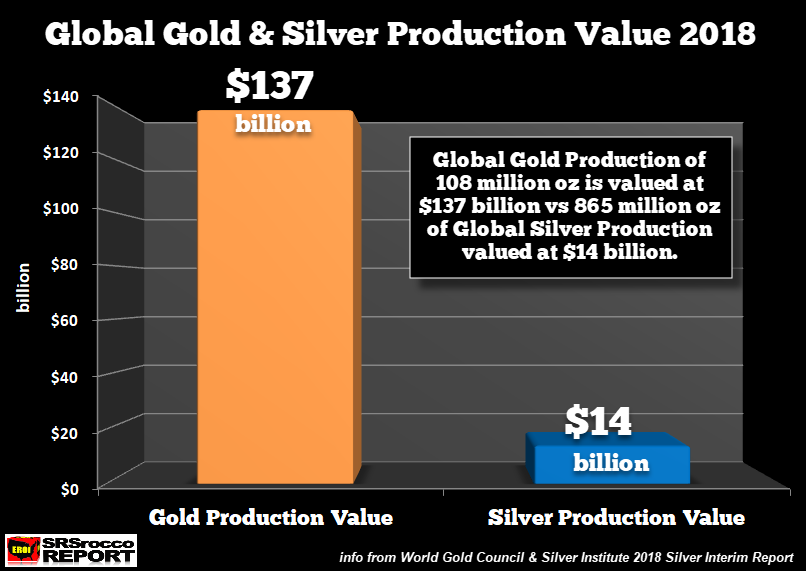
While the global silver production ratio to gold will be 8 to 1 this year, the value of the silver mine supply will be one-tenth that of gold. According to the Silver Institute’s Silver Interim Report, global silver production will increase to 865 million oz, up from 852 million oz in 2017. If we go by the average silver price of $15.80 so far for 2018, total silver production this year will be valued at $14 billion.
Thus, the total value of all gold and silver mined in 2018 is a measly $151 billion compared to the increase in global debt 1H 2018 of $8 trillion. What most investors fail to realize is that the massive $247 trillion of debt is propping up the assets in the market. So, when the debt implodes, so will the assets. On the other hand, gold and silver will still hold their value and likely increase significantly during the next market crash.
In my next article that will be published on Friday, I will show my estimated breakeven cost for the Top Five Gold Miners in the world as well as how their overall production continues to decline.
Happy Thanksgiving.
Check back for new articles and updates at the SRSrocco Report.

Independent researcher Steve St. Angelo (SRSrocco) started to invest in precious metals in 2002. Later on in 2008, he began researching areas of the gold and silver market that, curiously, the majority of the precious metal analyst community have left unexplored. These areas include how energy and the falling EROI – Energy Returned On Invested – stand to impact the mining industry, precious metals, paper assets, and the overall economy. He has written scholarly articles in some of the top precious metals and financial websites. Visit his website SRSrocco Report.


