Global Negative Yields Tell A Story Of Shifting Economic Strength


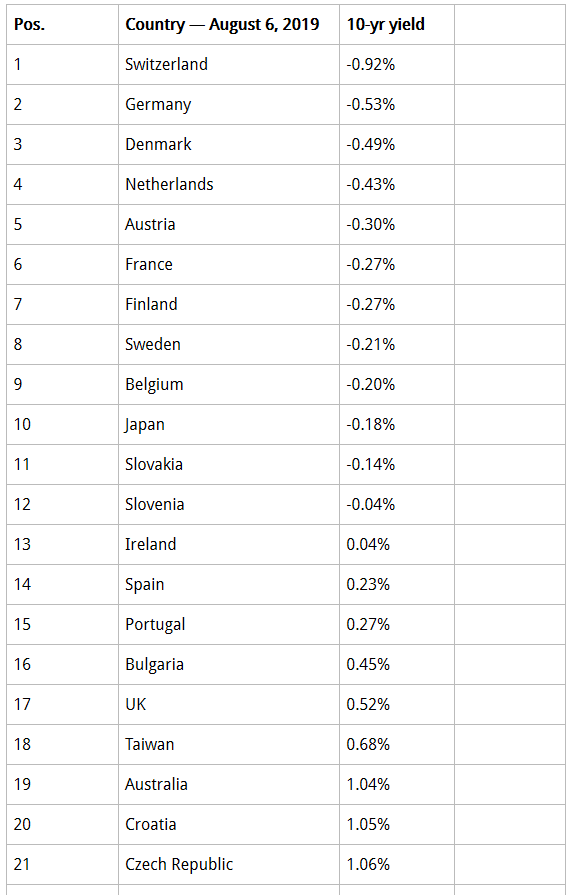
Negative yields are becoming common for many of the world's most mature economies. The process of extending negative yields within these economies suggests that safety is more important than returns and that central banks realize that growth and increases in GDP are more important than positive returns on capital. In the current economic environment, this suggests that global capital investors are seeking out alternative solutions to adequately develop longer-term opportunities and to develop native growth prospects that don't currently exist.
Our research team has been researching this phenomenon and how it relates to the continued “capital shift” that is taking place throughout the globe. We believe we have some answers for anyone interested in our opinions. We also believe the longer-term answers will depend on what happens over the next 5 to 7 years throughout the globe and how economic expectations shift as well as how global debt is dealt with.
We urge all of our followers to read all of the segments of this research post about how the global central banks are pushing the envelope and have been for many years :
Aug 14, 2019: Global Central Banks Move To Keep The Party Rolling (Part IV)
10-Yr Yields By Country
Throughout our research, we referenced a number of current articles to determine our own outcomes and expectations. Some of the articles we used as reference are listed below.
Sources for some of our research:
Each of these resources helped to create a bigger picture of what we believe will likely happen and how the process may unfold. We'll start by attempting to understand the core elements of the negative yield perspective and how/when it may change.
Negative yields are a result of expected economic malaise rooted in the understanding that GDP growth and economic output are relatively flat and not expected to rise. It comes down to the fact that if investors identified true growth opportunities in the major global economies, the yields for the debt instruments would reflect investor optimism (resulting in higher yields). Thus, the core element of the current global economic malaise is that the planet is transitioning from a very fragile 19th-century economic model into something new – we call it the 21st-century economic model.
This process will likely take an additional 10+ years to really begin to complete and may require many false starts as the world begins to understand exactly what is required to make this transition. Debt, as a process of engaging in economic activity, is something that is essential for some level of inflation, income, and the creation of future growth. Debt becomes a major issue when growth declines over extended periods of time resulting in a default risk for some nations/countries. Yet, as the human population continues to expand and global central banks continue to attempt to find the spark that will launch the new economic growth model, debt is essential to avoid economic contraction.
As we've hinted to, above, we believe the true answer is the transition away from 19th century economic structures that have resulted in massive risk factors (like unfunded pensions, unfunded state, and federal liabilities and massive global bank, investment banking and industrial level economic “black holes”) and to move towards true new world economic model. What that looks like is something we are considering at the moment and have a few ideas of.
Currently, there are a few new industries that show promise across the globe in terms of the new 21st-century economy and fledgling new industries.
_ Cannabis industry
_ Human Care Services Industry
_ Alternate housing Solutions
_ Eco-Sustainability Solutions
_ Fintech Wealth Creation Solutions
_ Social/Infrastructure Restoration Solutions
We believe the next 10+ years will become very fluid as traditional economic models are replaced with newer, more alternative, types of economic solutions that spark real growth industries and opportunities. We hope this process of transition initiates fairly quickly before any extended failure process takes place to start the reduction of capacity and resources that will be required for the rebuilding of the new 21st-century economy. Time will tell.
What this means for the rest of us is that we need to stay very focused on the fact that transitional asset shifts are very likely over the next 10+ years. The only time in history that we believe was similar to the current global economic environment was shortly after WWII. Global debts had skyrocketed and economic expectations throughout the planet were mild at best. Germany and most of Europe was beginning a rebuilding process while most of SE Asia and Japan were also attempting to rebuild and restructure after a brutal series of global wars. Much of the outside world was still in some form of an undeveloped economic structure at that time. For most of the developed world, the process of rebuilding and identifying real economic growth came nearly 20 years after the end of WWII – near the late 1950s and early 1960s as a type of Renaissance Era.
Given today's world and how quickly things progress, we believe the process may take about 7 to 14 years to complete this time – depending on how quickly we are able to transition the global away from risks and systematic failures that are a result of clinging to failed 19th-century components.
It is our opinion that wild price rotations in a variety of global assets will plague the global markets over the next 7+ years as pools of capital are moved into and out of opportunities for returns and gains. We believe all of the world's global markets are at risk for these very volatile rotations in price levels and that individual segments of the global markets will become targets for price declines and advances as capital attempts to force a “price discovery” process that seeks to identify true price values.
The process of true price discovery is convoluted with the steps of shaking off old expectations, risks, liabilities, falsehoods, and processes while attempting to identify real future value and executing the steps to transition these resources into renewed future expectations. It is almost like tearing down a structure in order to build something better and more efficient from the usable pieces of the old structure.
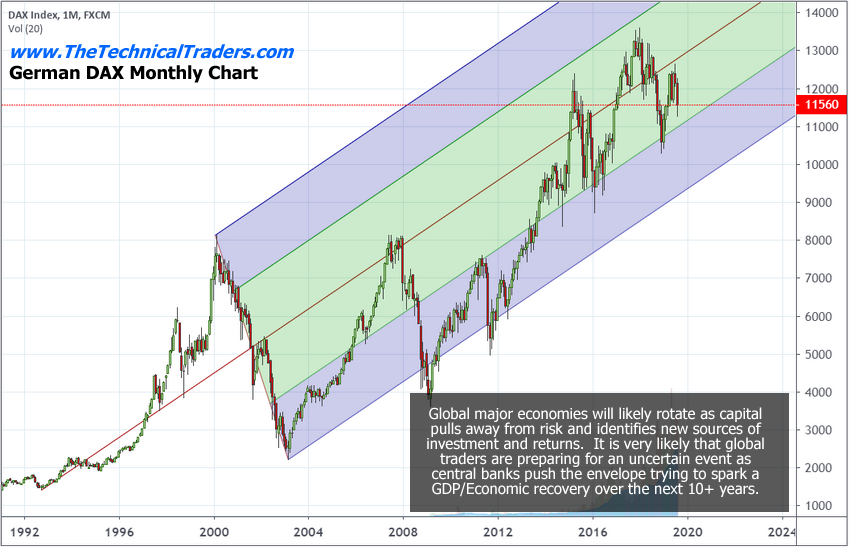
Our opinion is that skilled technical traders need to stay very fluid right now and to understand that broader risk factors are at play throughout the globe. Every major and minor economy on the planet will likely feel some aspect of the transition that is taking place within the global economy. We've highlighted a few charts, below, to show variations of risk as related to the trends that have taken place over the past 8+ years. Two of these charts shows a Pitchfork type of price channel. Once price breaks below these price channels, we enter a new territory of downward price trends that will begin the price discovery process.
German DAX Monthly Stock Index Trend
This chart of the German DAX suggests the lower price trend channel is currently near $9300. As time progresses, that channel continues to rise. We would expect the $10,000 level to be a critical psychological level going forward.
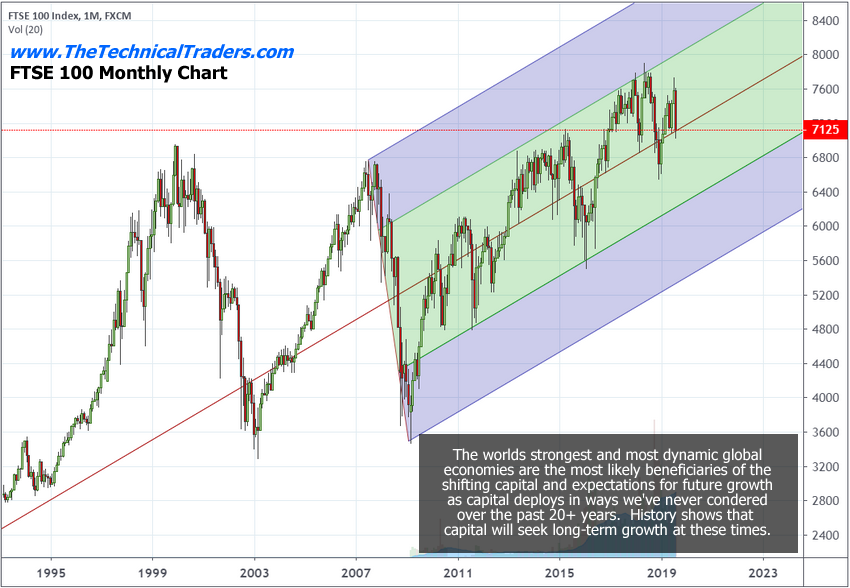
FSTE 100 Monthly Index Trend
This chart of the FSTE 100 shows a similar pattern where the lower price channel is near $5450 currently. As we progress further in time, that level continues to rise. We would suggest the $6000 will become critical for price support in the FTSE going forward.
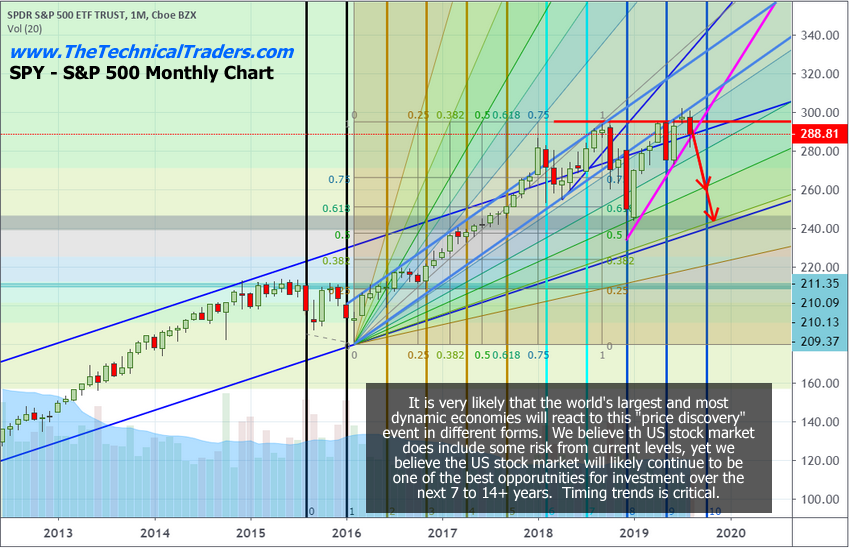
SP500 Index (SPY ETF) Monthly Trend Chart
The SPY sets up a similar pattern but shows more of our cycle and other research elements. The lower BLUE price channel, near $240, is our current price channel providing longer-term support. Below that level, we would fall back to the 2016 lows near $209.40.
Pay attention to what happens in the global markets over the next 6 to 18 months. The US Presidential election, Brexit and a host of other global issues are still playing out. We believe we are just starting this transition process and we believe now is the time for all skilled technical traders to fully understand that risks, price rotation, and true price discovery are very likely outcomes that may drive very wild price moves for many years into the future.
We urge all of our followers to read all of the segments of this research post about how the global central banks are pushing the envelope and have been for many years :
Aug 14, 2019: Global Central Banks Move To Keep The Party Rolling (Part IV)
CONCLUDING THOUGHTS
In closing, sit back and think about all the opportunities that will be created over the next 7+ years if you are skilled enough to trade these massive price swings. Think about how the world will transition away from risk factors that continue to plague our future and towards something that will usher in a 50+ year run of opportunity and gains. If you are young enough to enjoy this run, now is the time you will want to find a solid team of people that can help you navigate this process and find success.
We are only halfway into August and we have already closed out 24.16% in gains from the falling SP500 using SDS, and the pop in gold using UGLD, and from the oversold bounce and rally in silver miners SIL.
We urge all of our followers to pay attention to our research, consider your options very closely and prepare for this next move by pulling some of your active portfolio away from risks and into more protective measures. This Crazy Ivan event is just 10 days away and we really want to urge all of our followers to not under-estimate this event cycle.
WARNING SIGNS ABOUT GOLD, SILVER, MINERS, AND S&P500
In early June I posted a detailed video explaining in showing the bottoming formation and gold and where to spot the breakout level, I also talked about crude oil reaching it upside target after a double bottom, and I called short term top in the SP 500 index. This was one of my premarket videos for members it gives you a good taste of what you can expect each and every morning before the Opening Bell. Watch Video Here.
I then posted a detailed report talking about where the next bull and bear markets are and how to identify them. This report focused mainly on the SP 500 index and the gold miners index. My charts compared the 2008 market top and bear market along with the 2019 market prices today. See Comparison Charts Here.
On June 26th I posted that silver was likely to pause for a week or two before it took another run up on June 26. This played out perfectly as well and silver is now head up to our first key price target of $17. See Silver Price Cycle and Analysis.
More recently on July 16th, I warned that the next financial crisis (bear market) was scary close, possibly just a couple weeks away. The charts I posted will make you really start to worry. See Scary Bear Market Setup Charts.
FREE GOLD OR SILVER WITH MEMBERSHIP!

BECOME A TECHNICAL TRADER AND PROFIT
CLICK HERE
********

Chris Vermeulen has been involved in the markets since 1997 and is the founder of Technical Traders Ltd. He is an internationally recognized technical analyst, trader, and is the author of the book: 7 Steps to Win With Logic
Through years of research, trading and helping individual traders around the world. He learned that many traders have great trading ideas, but they lack one thing, they struggle to execute trades in a systematic way for consistent results. Chris helps educate traders with a three-hour video course that can change your trading results for the better.
His mission is to help his clients boost their trading performance while reducing market exposure and portfolio volatility.
He is a regular speaker on HoweStreet.com, and the FinancialSurvivorNetwork radio shows. Chris was also featured on the cover of AmalgaTrader Magazine, and contributes articles to several financial hubs like MoneyShow.com.


