Gold’s Current Advance is Getting Crazy


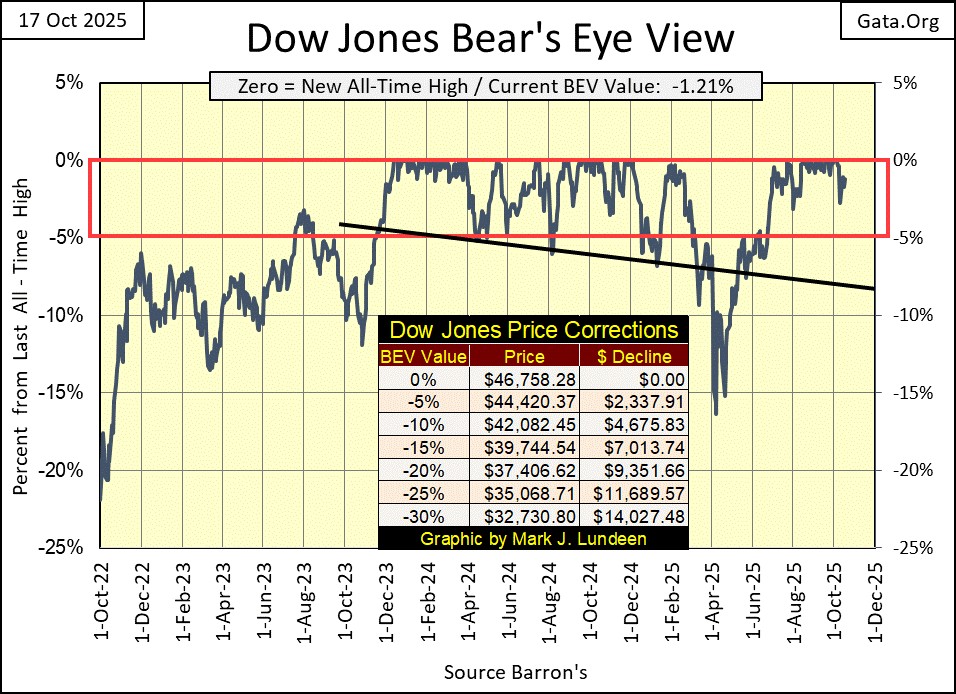
What is there to say about the Dow Jones at the end of third week of October 2025? It closed in scoring position, and we should expect additional new all-time highs – BEV Zeros in its Bear’s Eye View chart below, in the weeks and months to come.
In the last two years, the Dow Jones has generated sixty-six new all-time highs, an advance that has taken the Dow Jones up from 34,947 on 17 November 2023, when the Dow Jone first closed in scoring position (above its BEV -5% line in its BEV chart below), to 46,758 on October 3rd this year. That is an advance of 11,811 points, or a two-year gain of 33.79%. Though, that is something a Bear’s Eye View Chart would not see, as it sees each new all-time high as only a 0.0%, and never more. Daily closes not at a new all-time high, are seen as negative percentage claw-backs from their last all-time high.
Still, seeing the Dow Jones for the past two years remain in scoring position, within the red rectangle in the chart below, is a very impressive bull market advance. At this week’s close, we should assume additional new all-time highs in the weeks and months to come. But this isn’t going to last forever, as the day is coming when the Dow Jones will see a big-bear market decline.
That is very true, but for as long as the Dow Jones daily closes within scoring position, within 5% of its last all-time high, a big-bear market decline is something we don’t have to worry about. But when should we worry about that; a major bear market decline? Looking at the Dow Jones BEV chart below, seeing the Dow Jones break below its BEV -10% line, currently 42,082 in points, may be an early indication of bad things developing for the stock market.
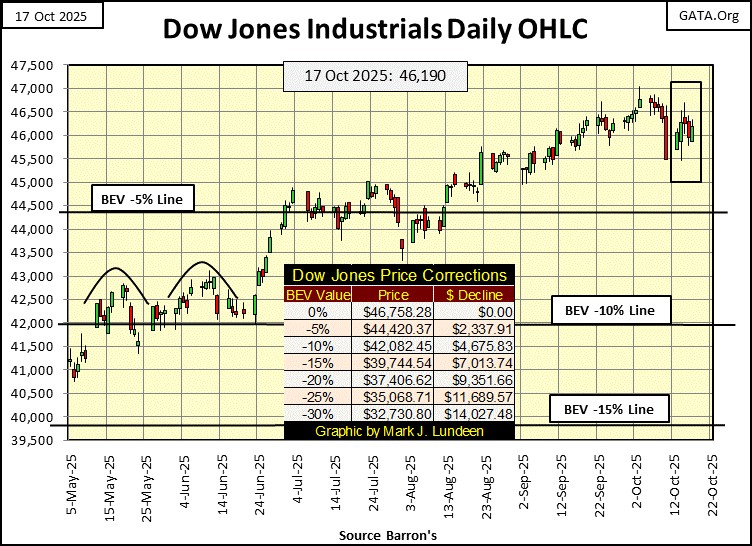
Next is the Dow Jones in daily bars. Last week saw five down days, with a big decline on Friday that promised nothing good for the stock market this week. Then this week, the Dow Jones recovered from the jitters of last week.
Now what? Well, had this week closed with the Dow Jones deep below its BEV -5% line, I’d say nothing good. But that didn’t happen. Rather, the Dow Jones closed the week well above its BEV -5% line. So, I’m going to remain optimistic on the stock market, until the Dow Jones is making a move to something below its BEV -10% line, or 42,082.
That is a simple way of looking at the stock market, but it’s a good way to look at it. So, why make it more complicated than we have to? Here is another simple way of looking at a bull market top, that the old guys from before the 1990s use to talk about selling at a market top; NO ONE CAN SELL AT THE ABSOLUTE TOP OF THE MARKET.
The old guys used to say that if an investor could exit the market within 10% of the top of a bull market, they would outperform 90% of the professionals in the market. These are good things to know;
- that a time comes for exiting the market,
- and it’s foolish attempting to sell at the absolute top of a bull market.
If someone risks a dollar in the stock market, and they make a few additional dollars from taking on those risks, they deserve a pat on the back – case closed! There are times when the best market strategy is to get out, and stay out of the market. I’m thinking this is one of those times.
So, looking at the stock market via the Bear’s Eye View, when the Dow Jones breaks below its BEV -10% line, investors may want to consider exiting this market, and not come back until the Dow Jones sees a 45% market decline.
Looking at the 140-year history of the Dow Jones below, in the Bear’s Eye View, a 40% or 45% market decline for the Dow Jones is pretty much standard for a bear market decline. The only exception to that rule of thumb is seen below; the Great Depression’s 89% market crash.
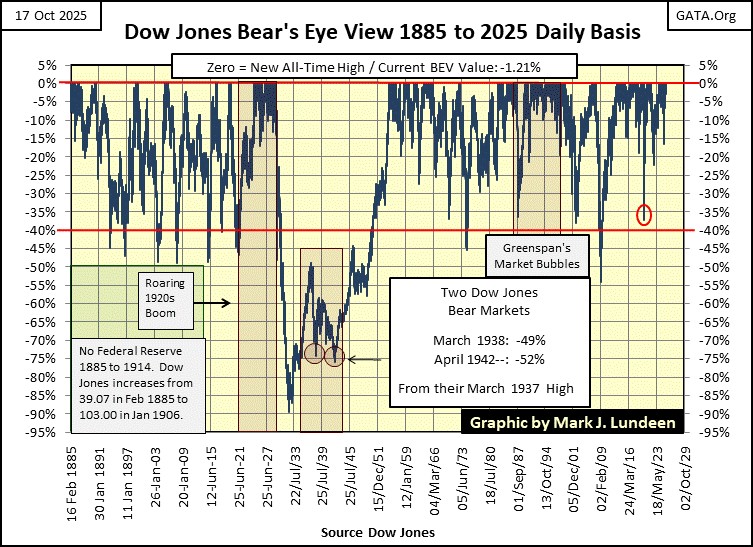
And that is my concern, that the coming bear market will be a reprise of the Great Depression market crash. My concerns are based on the dividend yield for the Dow Jones, something I’ve covered before, and will again, but not for this week.
Another item I’m following closely is the NASDAQ Banking Index below. The last time it saw a new all-time high was in November 2021, four years ago. All my other market indexes, including the XAU, have made new all-time highs since November 2021. So, why at this week’s close are these banks now 23.08% below their last all-time high of November 2021?
Considering we are in a bull market, it doesn’t take a “market expert” to see these banks are going the wrong way in the chart below.
And these banks are important. If they start reporting problems about this, that or something else that will motivate the idiots at the FOMC to begin “injecting liquidity” into them to prevent a run on their deposits, bad news like that could impact the rest of the stock market in a very negative way.
Here is a link to Zero Hedge on the problems regional banks are having. They don’t look good.
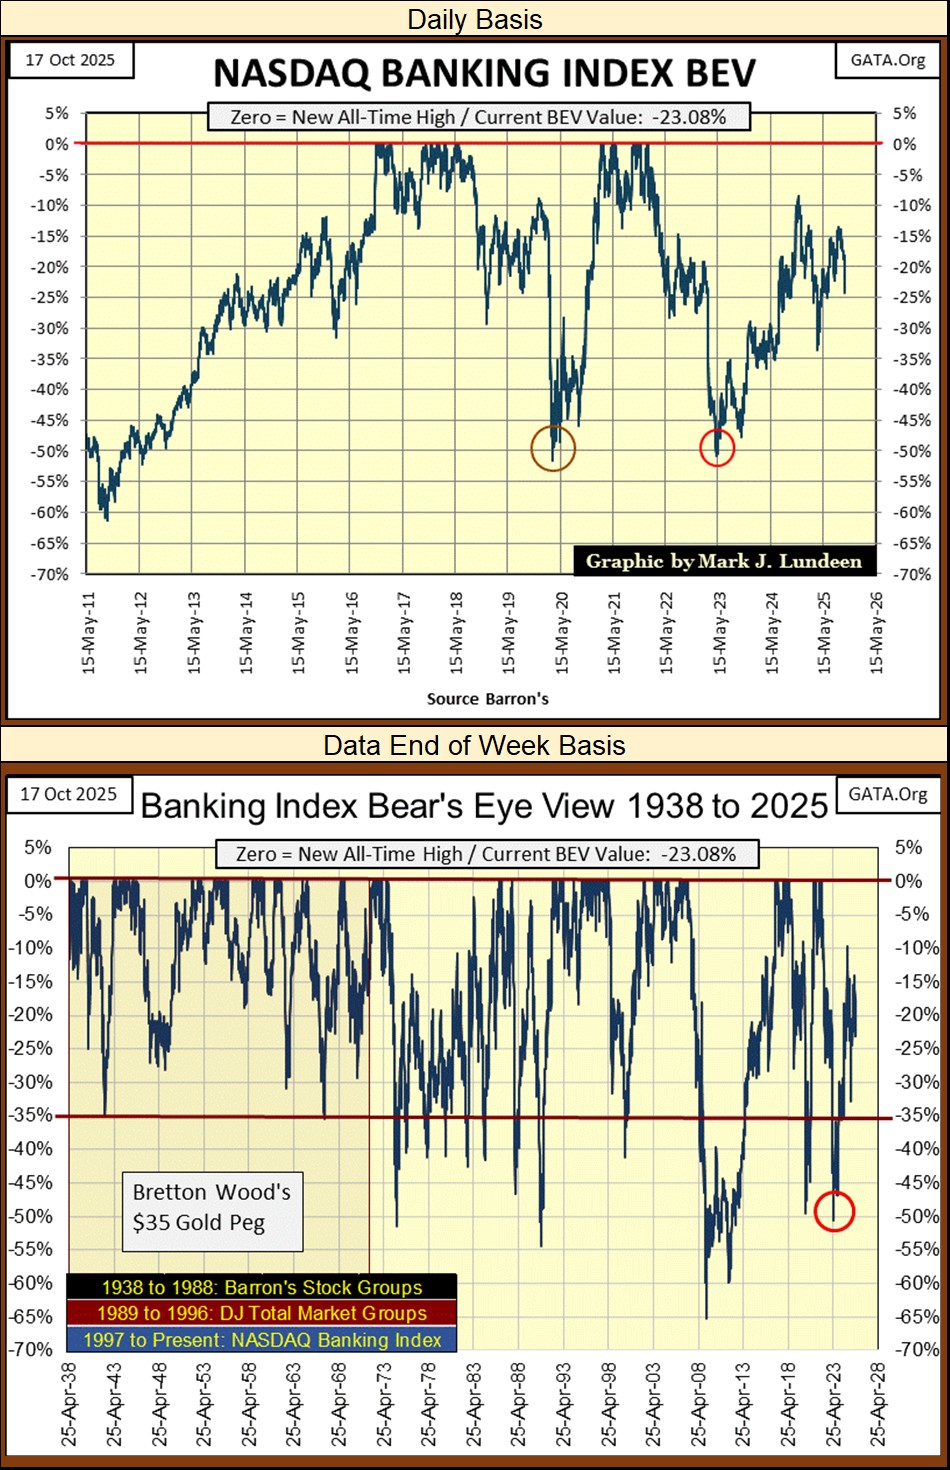
Stepping back in time, via the Bear’s Eye View of my banking index data above, before August 1971, before the US Government took the dollar off the Bretton Woods’ $35 gold peg, corrections for these banks bottomed with a 35% market decline. And from 1938 to 1971, the banks saw a 35% bear market bottom only twice during these thirty-three years.
After 1971, volatility for the US banking system increased dramatically, as seen in the BEV chart above. These banks all to frequently closing below their BEV -35% line in the past half century.
What do I know? Maybe these banks will once again be making new all-time highs, exactly like the other major-market indexes I follow. And then; maybe not. And if not; what then? If they break below their BEV -50% line, as they have twice since 2020, what will the rest of the stock market do? Maybe the reason gold, silver and their miners have done so well in the past year, is because these banks have done so poorly.
Let’s move on to my BEV values for the market indexes I follow in the table below. This week closed with none of these indexes at a new all-time high, but sixteen of them closed well within scoring position, less than 5% from their last all-time high. There were new all-time highs this week, but not many of them. The XAU (#18) saw three new all-time highs this week, and then was hammered down by 7.08% on Friday. That doesn’t matter, because gold and silver mining is the place to be in the market, and will be for quite a while to come.
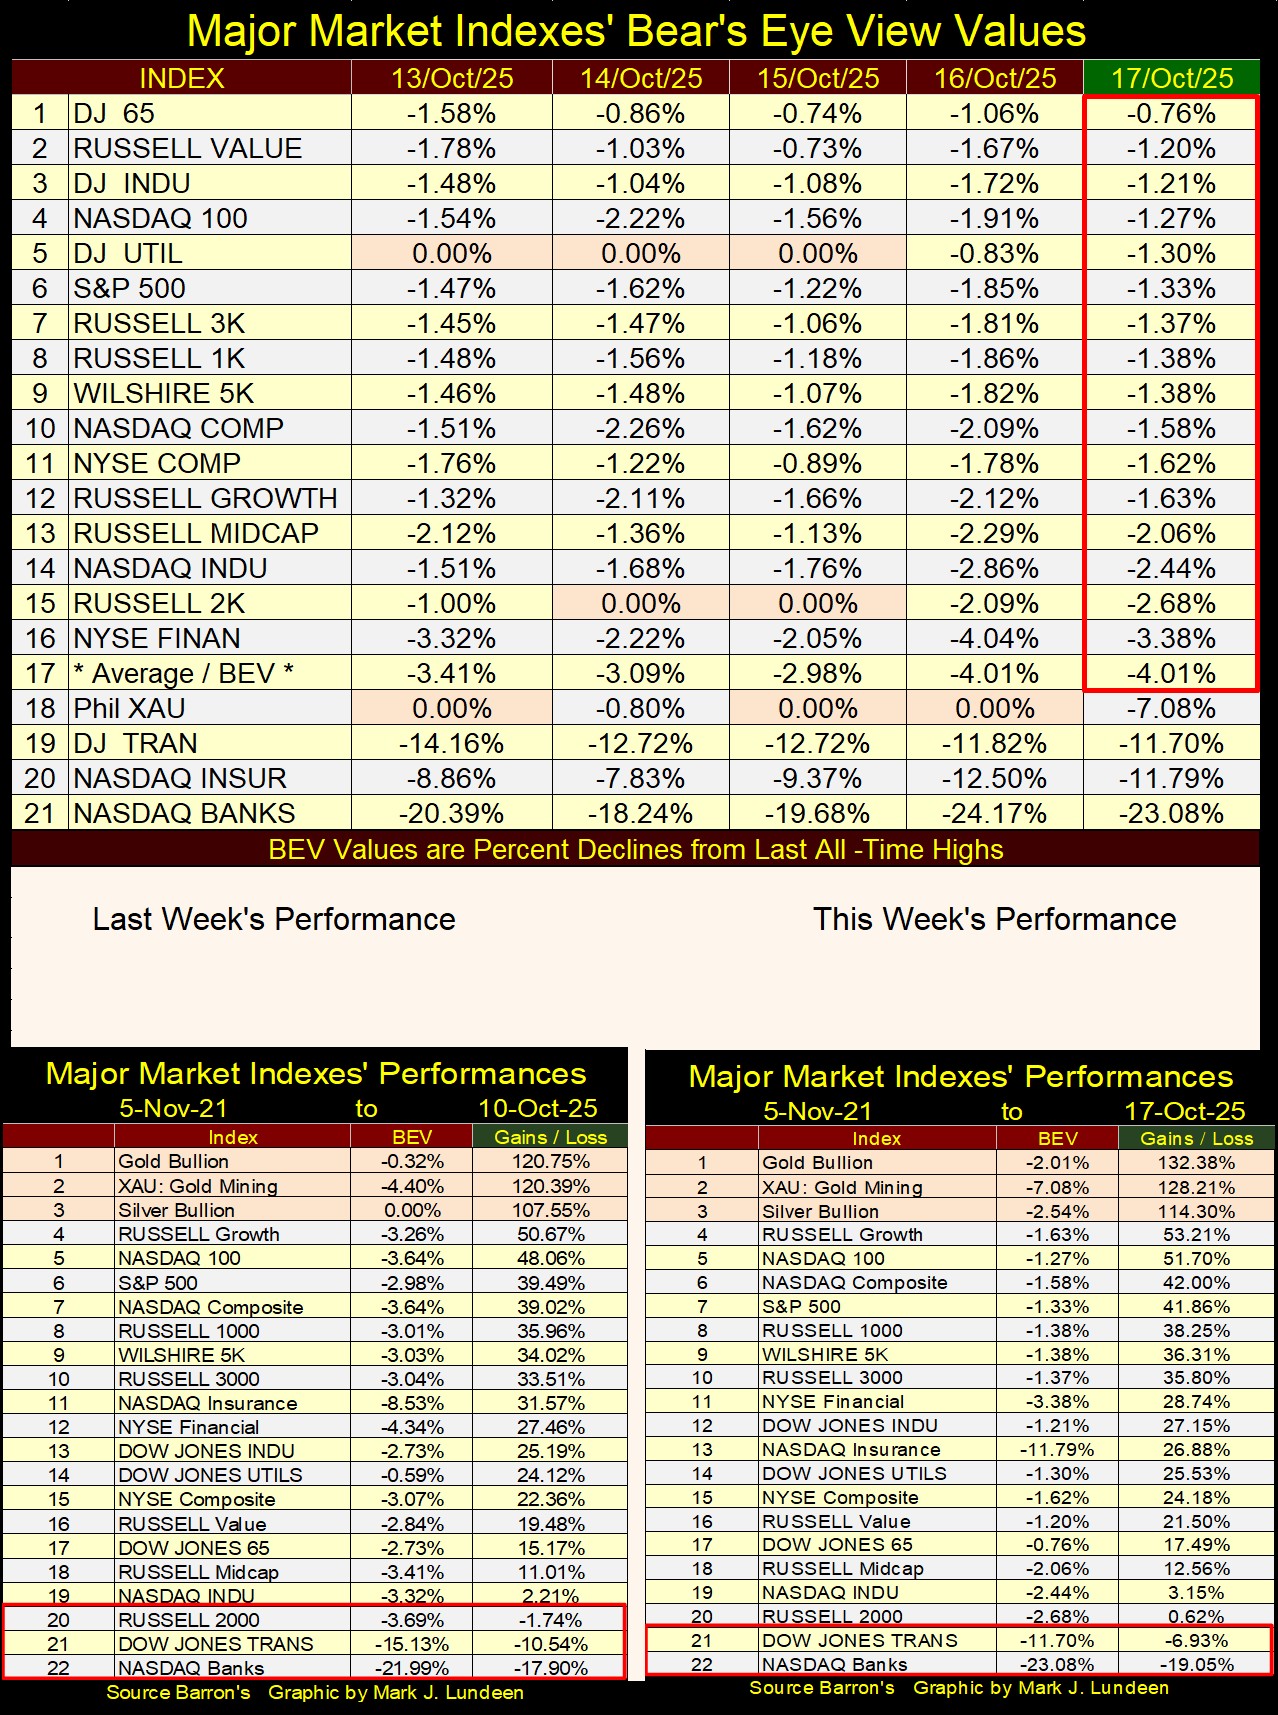
Looking at this week’s performance table above, even after Friday’s losses in the XAU, it still closed up from last week, as did gold and silver bullion. And look at the triple-digit percentage advances for gold, silver, and their miners, compared to the double-digit percentage advances for the next fifteen indexes, and the double-digit losses for the banks.
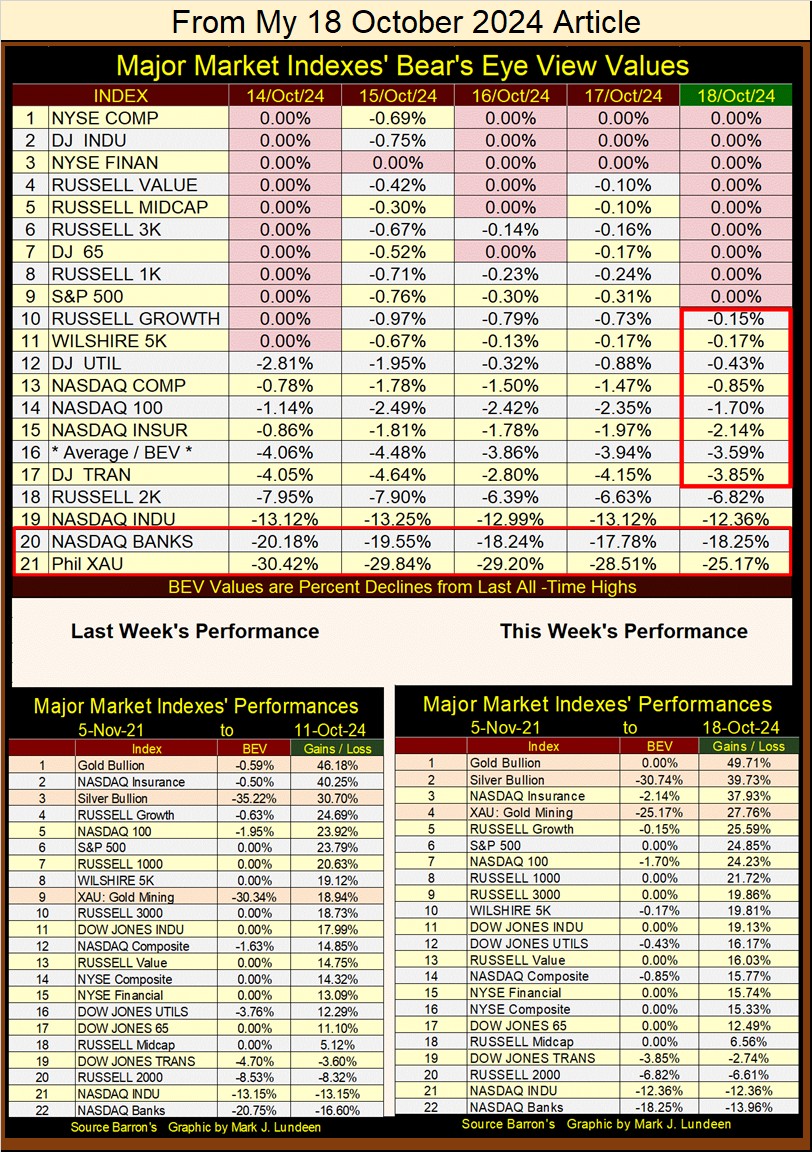
FYI, below is the same table from a year ago. Looking at the market data I do follow, which excludes cyber-currencies and AI stocks, in the past twelve months, gold, silver, and the XAU have outperformed everything else by a large margin.
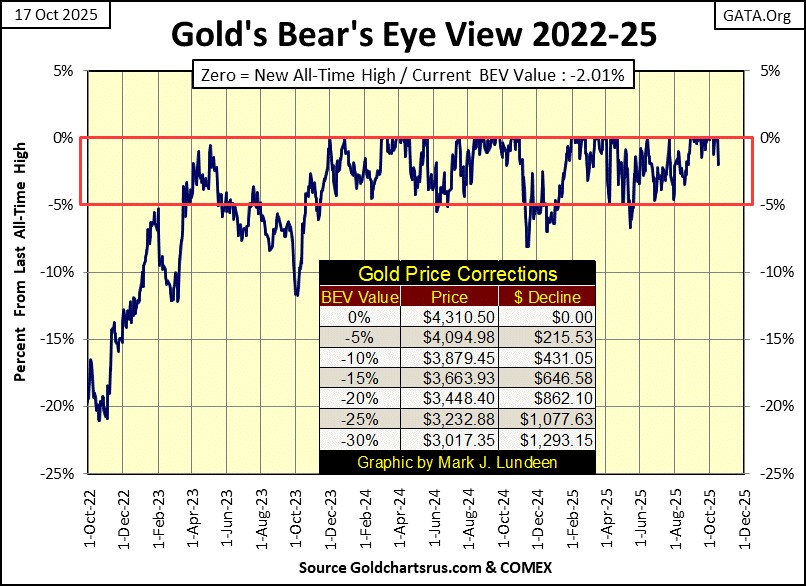
Next is my BEV chart for gold. As with the BEV chart for the Dow Jones, gold this week closed inside of scoring position. So, like the Dow Jones, we should anticipate additional BEV Zeros; new all-time highs in the weeks and months to come.
But where the Dow Jones has seen sixty-six new all-time highs since entering scoring position two years ago, gold has seen eighty-seven, with the last twenty of those new all-time highs since the end of August, in the past seven weeks.
Geeze Louise! What’s with that? Where is the demand coming from that took gold up by 23% since August 28th?
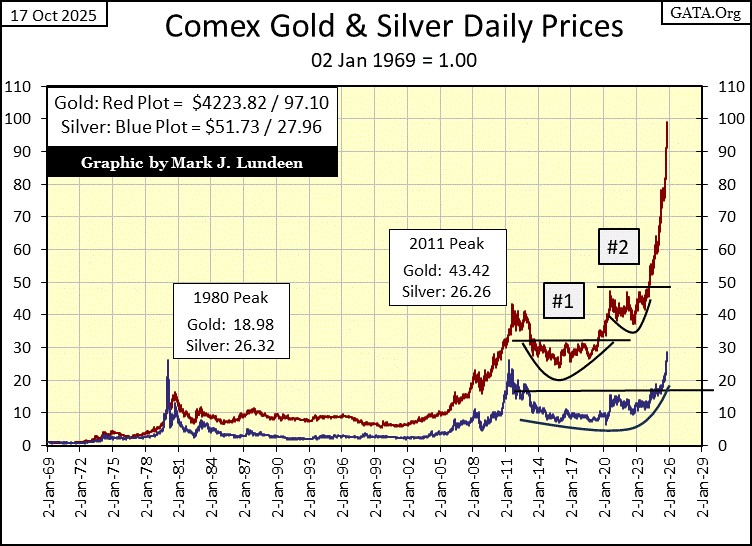
Moving now to my chart of gold and silver in indexed values, with 02 January 1969 = 1.00. I’ve said it before, and I’ll say it again, looking at these plots makes me think gold and silver are due for a big correction in their advance. But week after week, they don’t correct, they only advance to higher levels.
Oh, one day we’ll see gold and silver below correct by 20% or 30%. But I’m not the guy to make that call of exactly when that will happen. So, watching gold and silver advance in the chart below is only a spectator sport for me, as I’m not going to make any calls that they will do this, or that, as there is something driving them upwards that I don’t understand.
I get a whiff of desperation in the current rise in the old monetary metals seen below. Like for someone, it’s either exchange their many billions-of-dollars, euros, yen, etc. for gold and silver now, or have this opportunity to do so pass forever. We may be witnessing history in the making below.
In the next two weeks, if I have to adjust the scaling in this chart to 120 to contain the indexed value of gold below, I’m going to freak out. No, seeing me freak out doesn’t mean you’ll see my name, frequently repeated in the national news for doing something despicable.
I’ll most likely just go into a dark room, and sit there for hours with no stimulation coming to me from the outside world. A little bourbon may help me in my hour of need, because the only reason I can see for gold and silver rising like this, is because something really, really bad is about to happen.
My thinking on this is; the rats are fully aware of any pending problem in the market, most likely because they are the cause of it. So, they are jumping off a sinking ship, on to gold and silver to survive what they know is coming. I hope I’m wrong, but I fear I’m not.
One thing I do understand; this amazing rise in the price of gold and silver is happening as the available, above ground stocks of gold and silver are being drained from the market. Much of this gold and silver now leaving the market, may never come back, no matter how many dollars per ounce future buyers will offer for it.
So, about the time the public, and money managers decide to buy some gold and silver for their portfolios, there may not be much left for the public and professional money managers to buy. Will the people now buying gold and silver by the ton, then be willing to exchange their gold and silver for the fiat currencies now managed by the global central banking cartel, no matter what the price? Maybe not.

The study of monetary history may not be as widespread as I would have it, but to those at the top, they know the history of paper money very well. And once monetary inflation becomes the “monetary policy,” it ends only one way; inflationary booms always turn into deflationary busts, as John Law discovered in early 18th century France.

Keep the above in mind, because there is nothing new under the sun, as we learn reading the book Ecclesiastes below.
Looking at gold’s step sum table below, since September 14th, gold has seen fifteen new all-time highs. I like seeing gold’s valuation rise, but this is getting crazy. Gold since September 14th has been an overbought market, as seen by the multiple 15-counts of +7s, +9s and now +11s. How much longer can this go on?
With all of these new all-time highs, I would think gold’s daily volatility’s 200D M/A would be much higher than the current 0.86%, but it isn’t. That suggest this buying in the gold market, isn’t a buying panic, but disciplined purchases. The panic buying will come, but obviously at much higher prices.
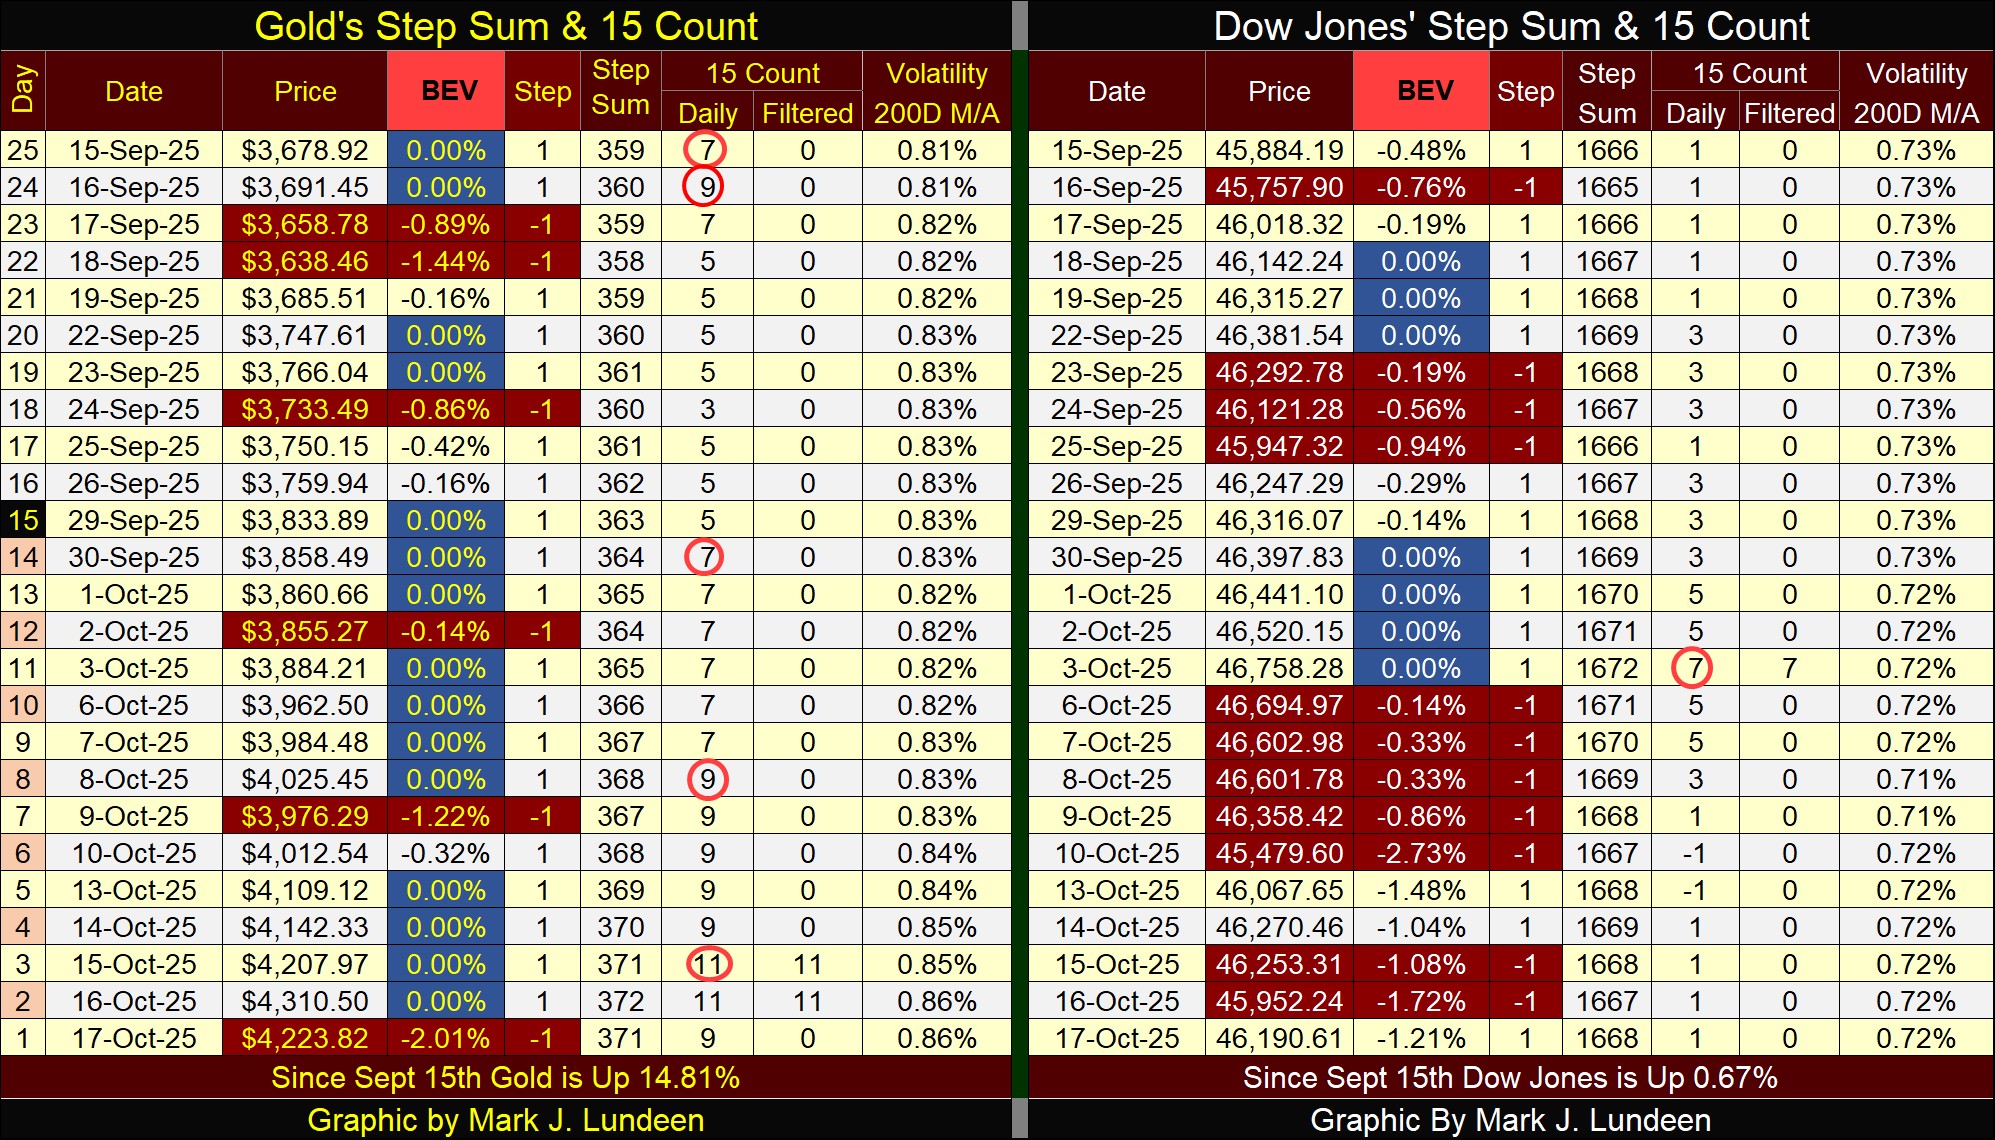
On the Dow Jones side of the step sum table, we see what should happen when a market’s 15-count becomes overbought with a +7; it takes a break by selling off a bit. Look at gold, this week its 15-count hit an extremely overbought +11, which should tell us gold is way overdue for a sell off. But I have this feeling, that the gold market isn’t going to sell off anytime soon.
That is what I think of next week, at this week’s close. A week from now, we’ll see if I got that right, or not.
Mark J. Lundeen
********


