Gold’s Secular Bull Market


I would like to update some long-term charts for Gold to give you a feel for where Gold is at in its secular bull market that began at the 2000 double bottom low. I’ve said a million times that big patterns lead to a big move and the bigger the pattern the bigger the move.
For instance, if you see a consolidation pattern form on a daily chart that took six months to build out then you can expect a move that is relative to the size of the consolation pattern. On the other hand if you see a trading range form over years you can expect to see a long-term move, again it is all relative to time and price.
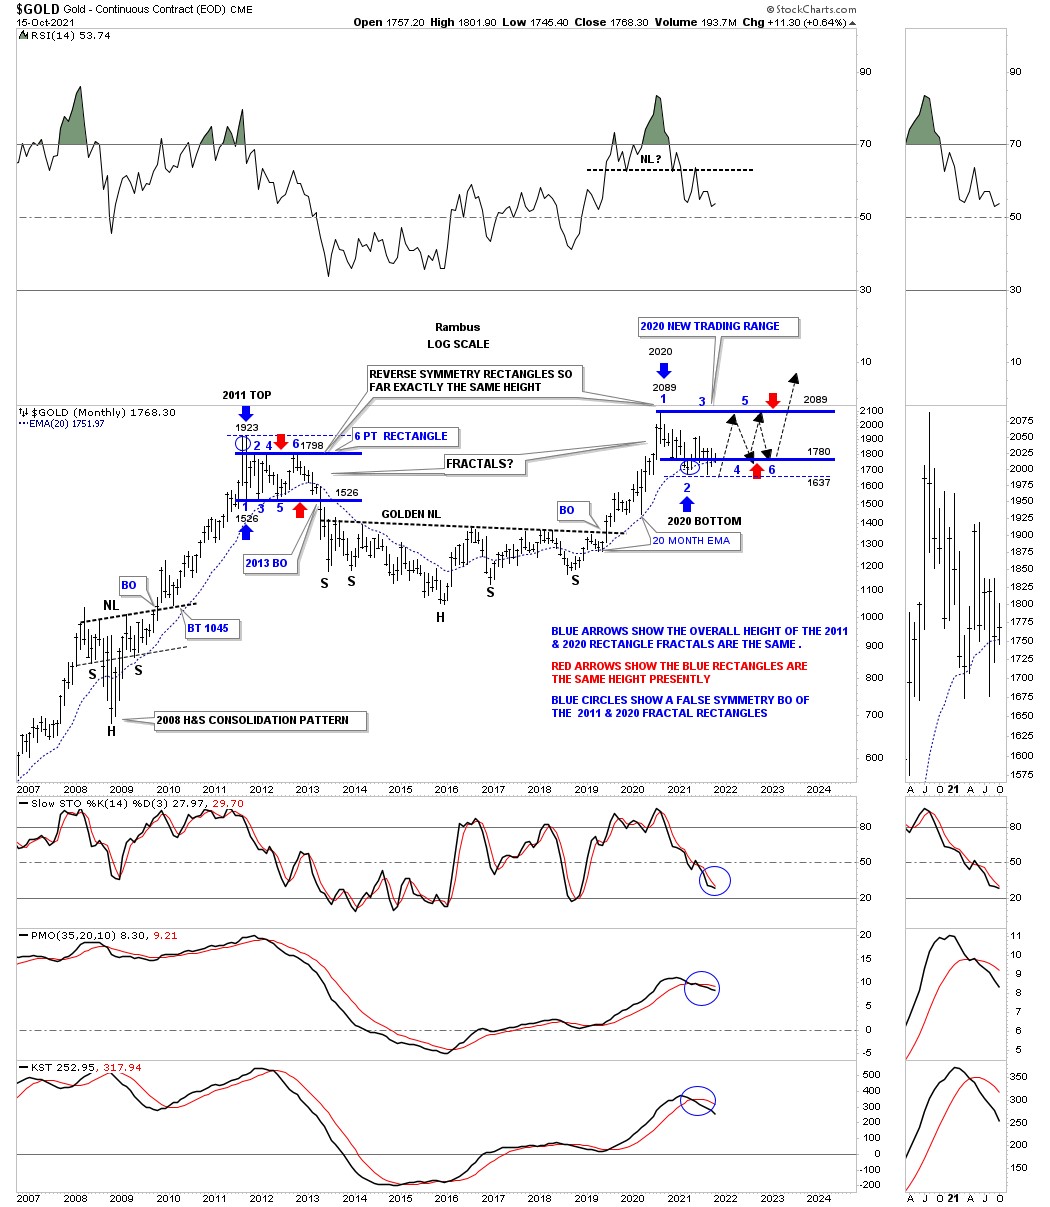
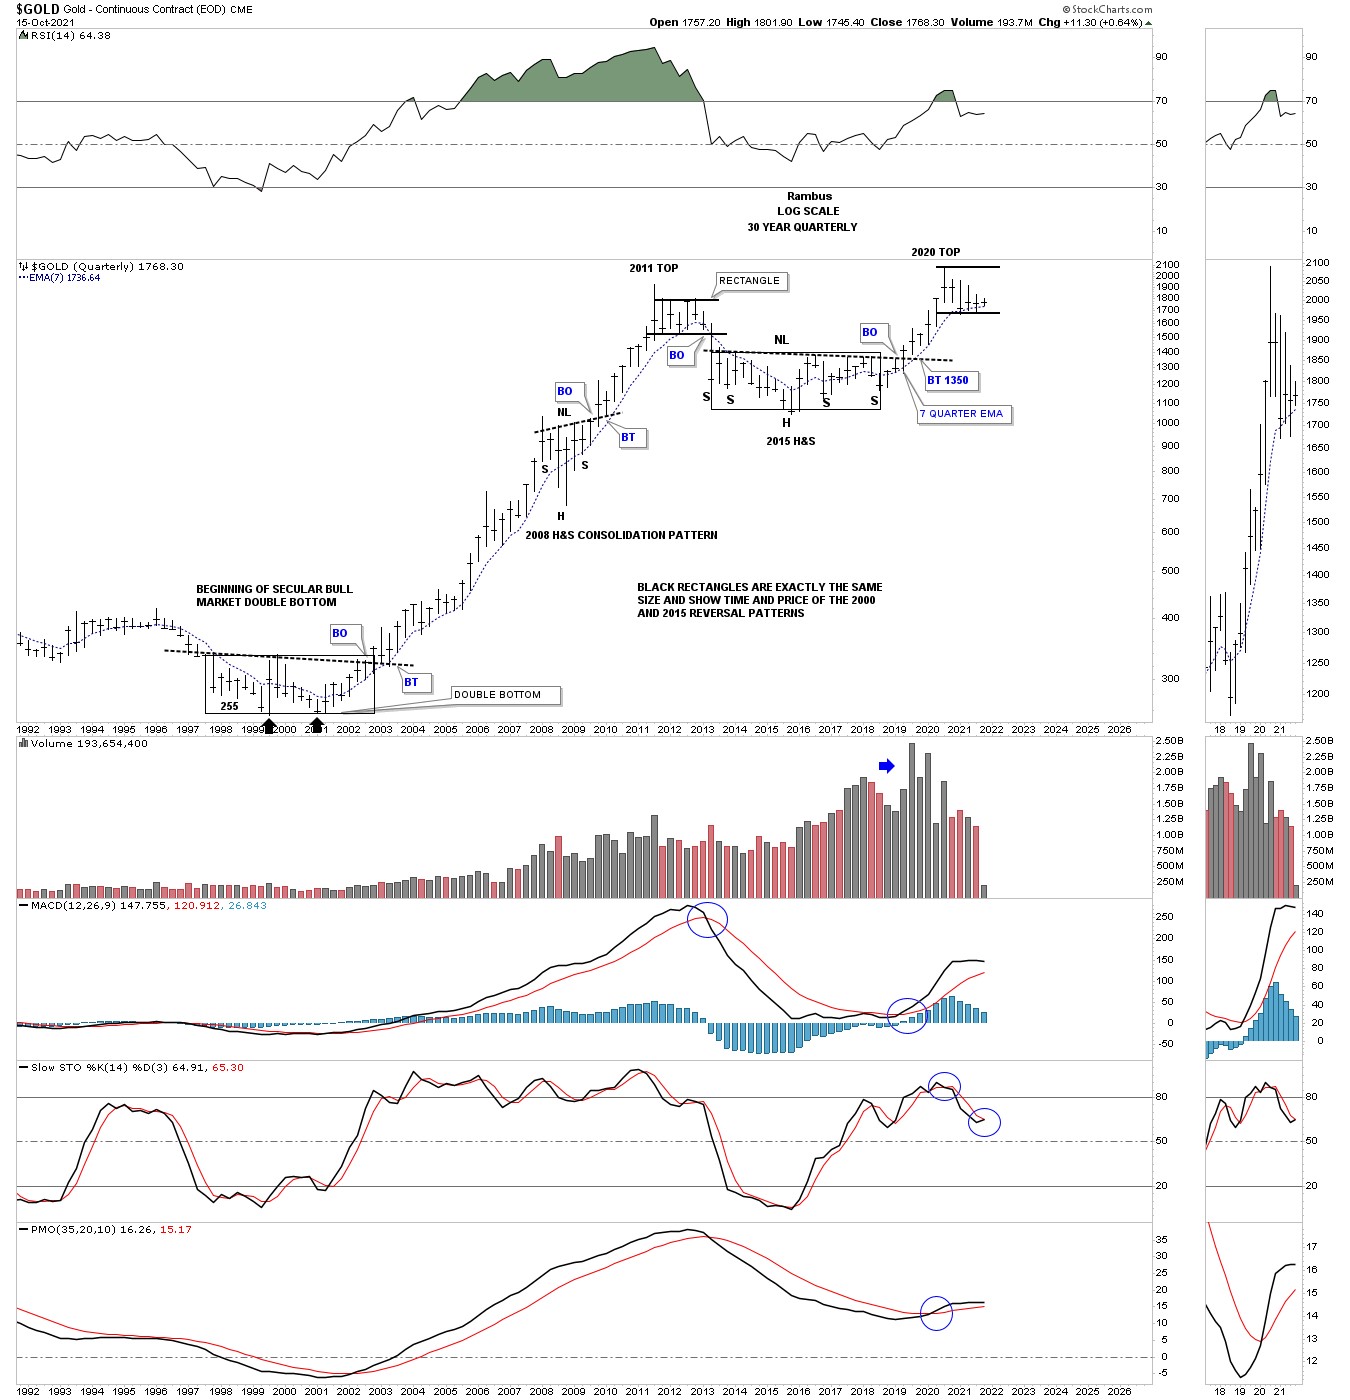
I would like to start by looking at this long-term monthly chart for Gold which shows its nearly six-year H&S bottom which launched Gold to its new all-time high in 2020. I don’t show it on this chart but how Gold came down during its bear market years is how Gold rallied over the same area on the way up to its 2020 high which I call reverse symmetry.
If you recall I started to show this chart late last year showing how our current trading range was forming a possible fractal to the 2011 trading range. So far the new trading range has worked out almost perfectly with one minor exception. The blue circle at reversal point #2 in our current trading range was the equivalent to the blue circle at the 2011 high. I was expecting Gold to rally back up to the top of our current trading range to complete the second reversal point. As you can see Gold did bounce off reversal point #2 and made it above halfway back to the top of the trading before declining once again.
The only flaw so far in regards to the 2011 and 2020 fractal trading ranges is that Gold declined all the way back down to the thin blued dashed trendline at the bottom of the trading range which held once again but I was actually looking of the solid blue trendline to hold support. Other than that one little hiccup nothing has changed since I first built this chart.
Below is the same chart as the one above but is a little less cluttered which shows the reverse symmetry as shown by the blue arrows.
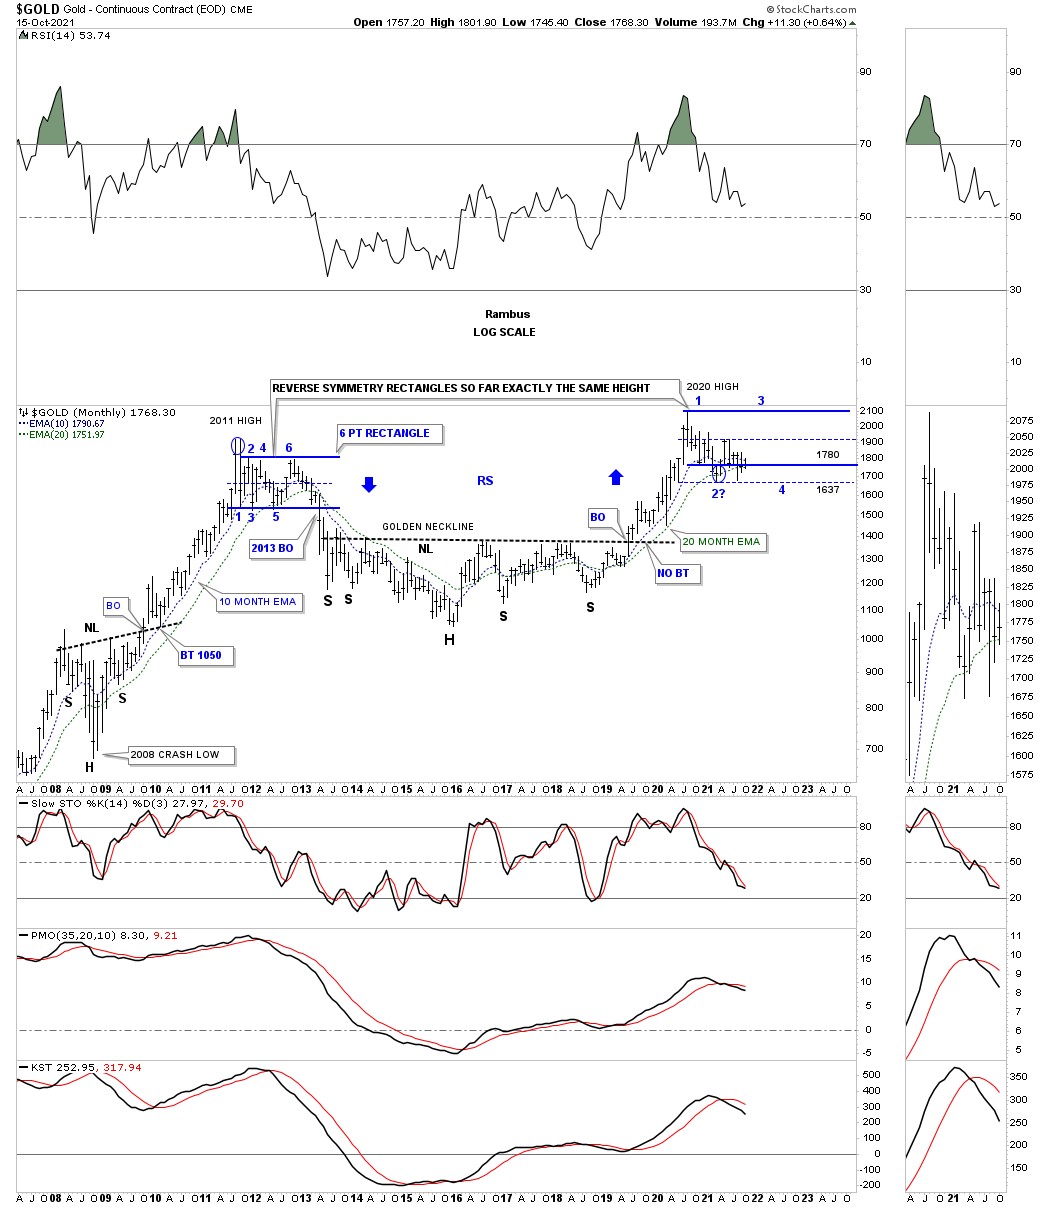
Again, the same chart which shows the 2011 and 2020 blue trading range are the exact same height on a log scale.

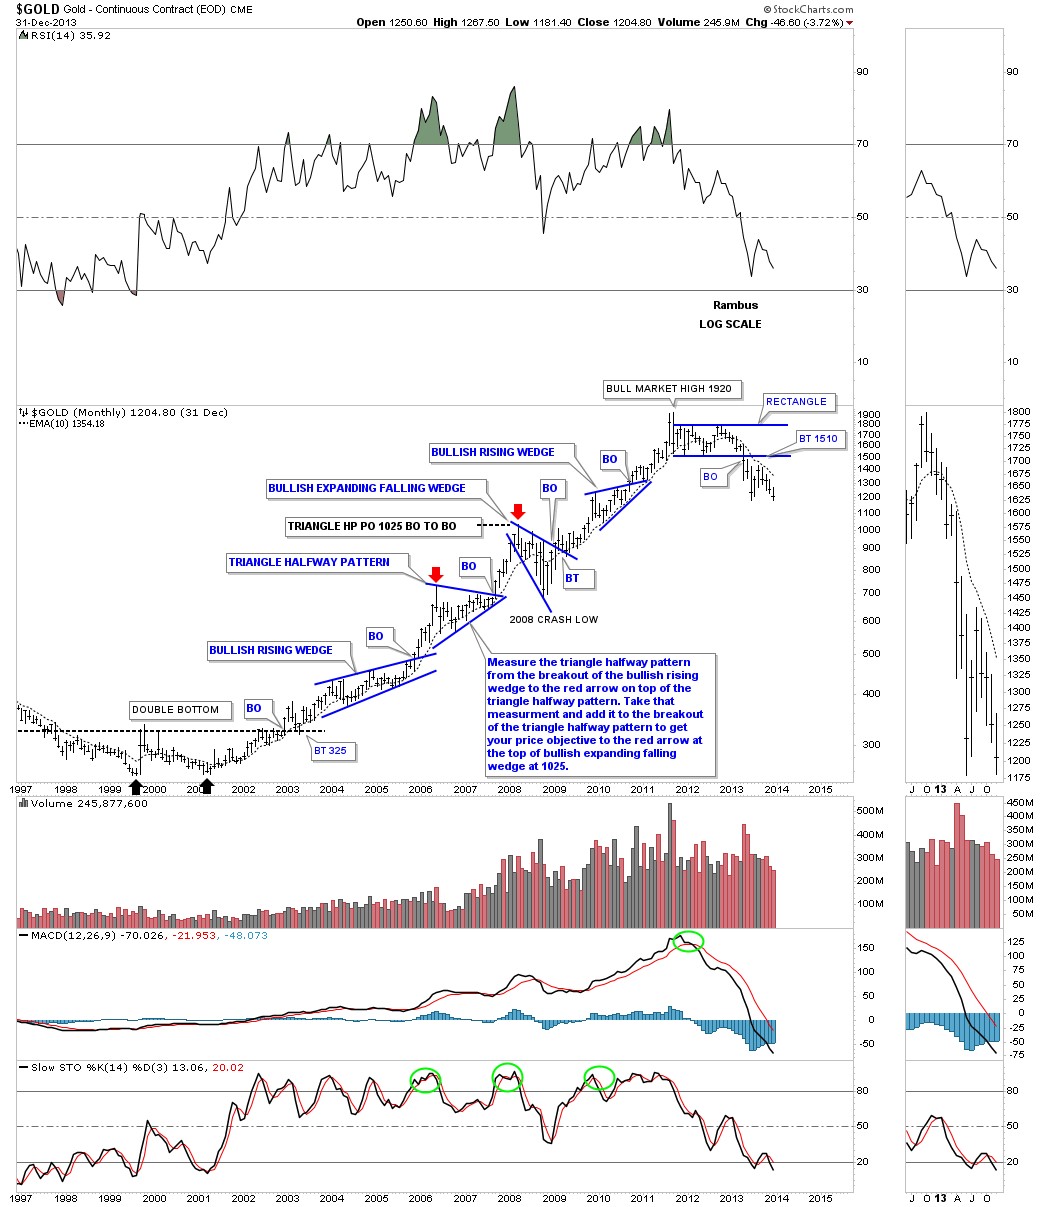
Hopefully for future reference this is how the 2000 to 2011 bull market looked from a Chartology perspective. There was a big multi year double bottom which launched the bull market which formed four big consolidation patterns. The first consolidation pattern was a bullish rising wedge which I have shown you many times that when the breakout takes out the top rail that is showing very bullish characteristics. After the impulse move was finished Gold formed the triangle consolation pattern that led to the next impulse move.
After the price objective was met the PM complex as whole began the infamous 2008 crash which formed another very bullish consolidation pattern we’ve been following on many different commodities charts recently, the bullish expanding falling wedge. The impulse move out of the bullish expanding falling wedge led to the 4th impulse move out of the 2000 low. After that impulse move ended Gold formed its last consolation pattern which was another bullish rising wedge which led to the 2011 all time high back then.
I often said during that 2000 to 2011 bull market that investors would look back at that time period and call it on of the best looking bull markets in history, which from a Chartology perspective it was. Nothing keeps going up forever and after 11 years it was time for Gold to rest and consolidate its gains.

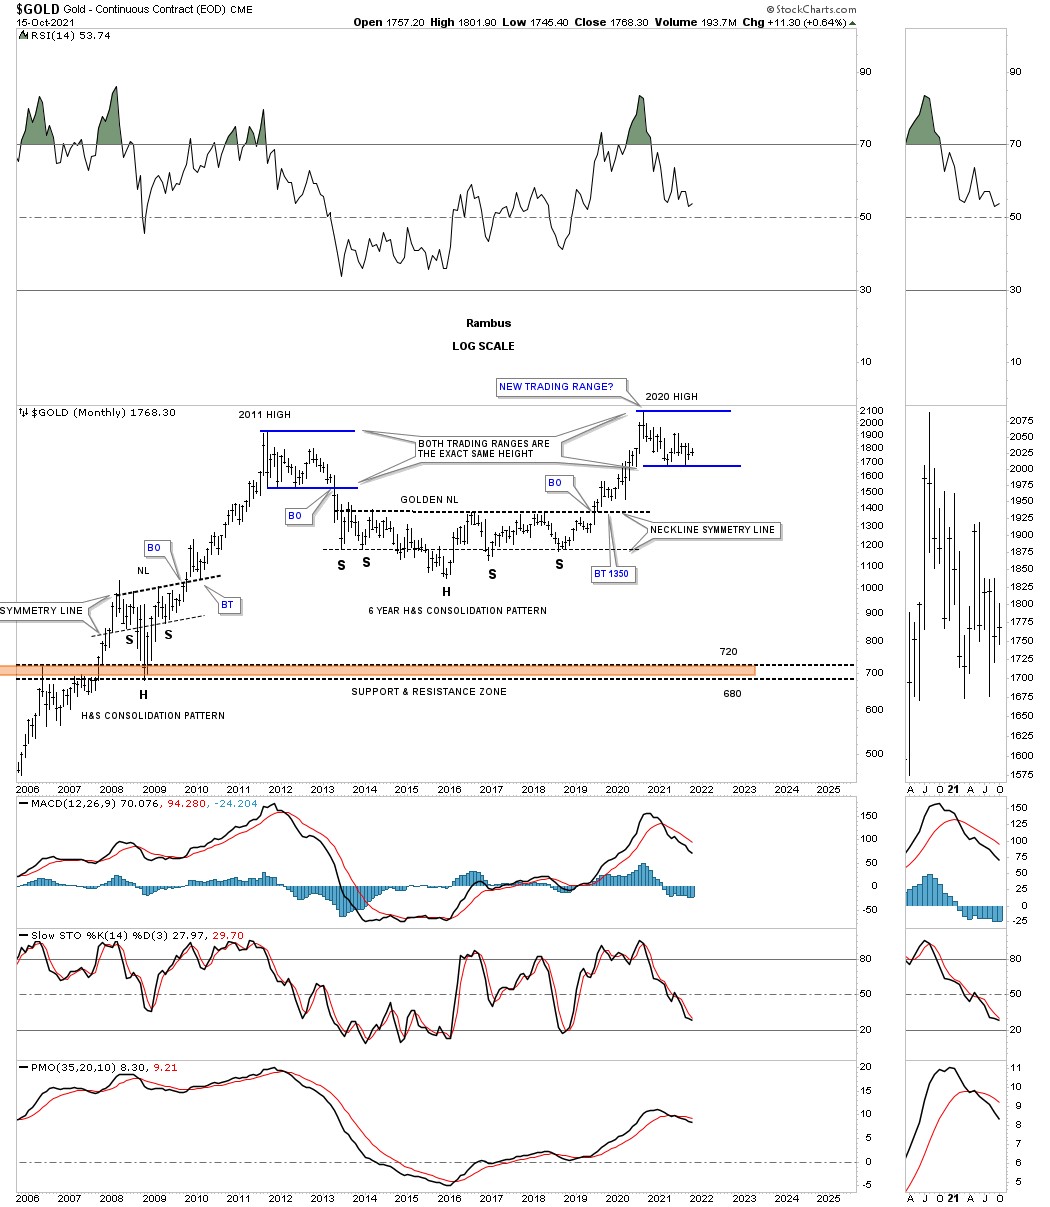
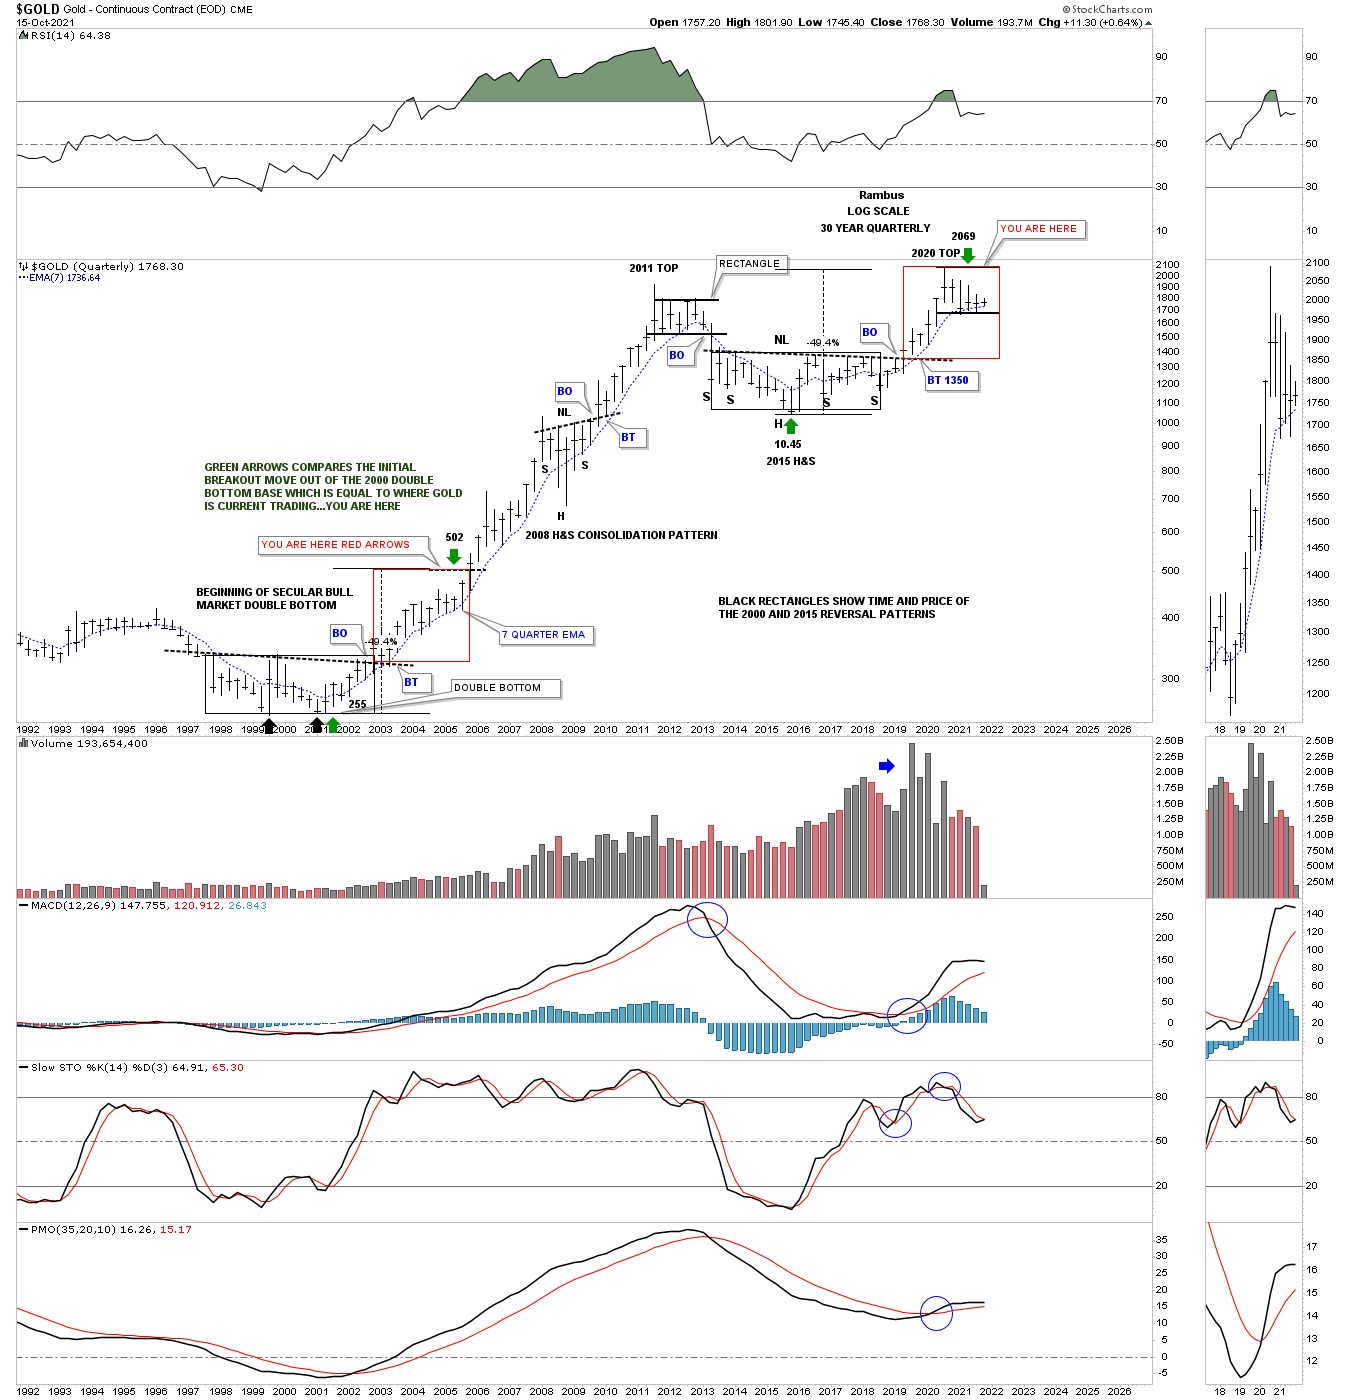
Referring back to the beginning of this post I mentioned that big trading ranges can lead to big moves and the bigger the trading range the bigger the move. Looking at the bear market double bottom low in 2000 it had enough gas in its tank to launch an 11 year bull market. I added the black rectangle to show you its time and price, time being the length and price measuring the high and low points.
I added that exact same black rectangle to the 2015 H&S bottom to compare the two bases, upper black rectangle. Price wise both patterns are exactly the same height. Since this is a quarterly chart it may take Gold two more quarters or six months to complete its current trading range. So the 2015 H&S bottom is actually a bit bigger than the 2000 double bottom reversal pattern which produced an 11 year bull market,
I would like to update some long term charts for Gold to give you a feel for where Gold is at in its secular bull market that began at the 2000 double bottom low. I’ve said a million times that big patterns lead to a big move and the bigger the pattern the bigger the move.
For instance if you see a consolidation pattern form on a daily chart that took six months to build out then you can expect a move that is relative to the size of the consolation pattern. On the other hand if you see a trading range form over years you can expect to see a long term move, again it is all relative to time and price.
I would like to start by looking at this long term monthly chart for Gold which shows its nearly six year H&S bottom which launched Gold to its new all time high in 2020. I don’t show it on this chart but how Gold came down during its bear market years is how Gold rallied over the same area on the way up to its 2020 high which I call reverse symmetry.
If you recall I started to show this chart late last year showing how our current trading range was forming a possible fractal to the 2011 trading range. So far the new trading range has worked out almost perfectly with one minor exception. The blue circle at reversal point #2 in our current trading range was the equivalent to the blue circle at the 2011 high. I was expecting Gold to rally back up to the top of our current trading range to complete the second reversal point. As you can see Gold did bounce off reversal point #2 and made it above halfway back to the top of the trading before declining once again.
The only flaw so far in regards to the 2011 and 2020 fractal trading ranges is that Gold declined all the way back down to the thin blued dashed trendline at the bottom of the trading range which held once again but I was actually looking of the solid blue trendline to hold support. Other than that one little hiccup nothing has changed since I first built this chart.

Below is the same chart as the one above but is a little less cluttered which shows the reverse symmetry as shown by the blue arrows.

Again, the same chart which shows the 2011 and 2020 blue trading range are the exact same height on a log scale.
Hopefully for future reference this is how the 2000 to 2011 bull market looked from a Chartology perspective. There was a big multi year double bottom which launched the bull market which formed four big consolidation patterns. The first consolidation pattern was a bullish rising wedge which I have shown you many times that when the breakout takes out the top rail that is showing very bullish characteristics. After the impulse move was finished Gold formed the triangle consolation pattern that led to the next impulse move.
After the price objective was met the PM complex as whole began the infamous 2008 crash which formed another very bullish consolidation pattern we’ve been following on many different commodities charts recently, the bullish expanding falling wedge. The impulse move out of the bullish expanding falling wedge led to the 4th impulse move out of the 2000 low. After that impulse move ended Gold formed its last consolation pattern which was another bullish rising wedge which led to the 2011 all time high back then.
I often said during that 2000 to 2011 bull market that investors would look back at that time period and call it on of the best looking bull markets in history, which from a Chartology perspective it was. Nothing keeps going up forever and after 11 years it was time for Gold to rest and consolidate its gains.
Referring back to the beginning of this post I mentioned that big trading ranges can lead to big moves and the bigger the trading range the bigger the move. Looking at the bear market double bottom low in 2000 it had enough gas in its tank to launch an 11 year bull market. I added the black rectangle to show you its time and price, time being the length and price measuring the high and low points.
I added that exact same black rectangle to the 2015 H&S bottom to compare the two bases, upper black rectangle. Price wise both patterns are exactly the same height. Since this is a quarterly chart it may take Gold two more quarters or six months to complete its current trading range. So the 2015 H&S bottom is actually a bit bigger than the 2000 double bottom reversal pattern which produced an 11 year bull market,

Lets take it one step further to try and find where Gold is currently trading vs the initial breakout move above the double bottom trendline that was made at the 2000 low. Keep in mind fractals are never exact duplicates of each other. As long as they are following the script fairly closely you can have minor divergences and not hurt the fractals.
This is the exact same chart as the one above but this time I’m using the red squares to compare where Gold is currently trading vs the initial breakout move above the double bottom trendline in October of 2002. As you can see price wise Gold has reached the same height as the initial rally after the breakout from the double bottom trendline as shown by the red squares. Time wise it looks like Gold could have a few more quarters of backing and filling before it breaks out to new all-time highs if this possible fractal look at gold plays out exactly like the 2000 low. The high Gold made in 2020 if equivalent to where Gold was trading back in October of 2005 which left another 6 years before Gold actually topped out and began it consolidation phase, you are here green arrows.
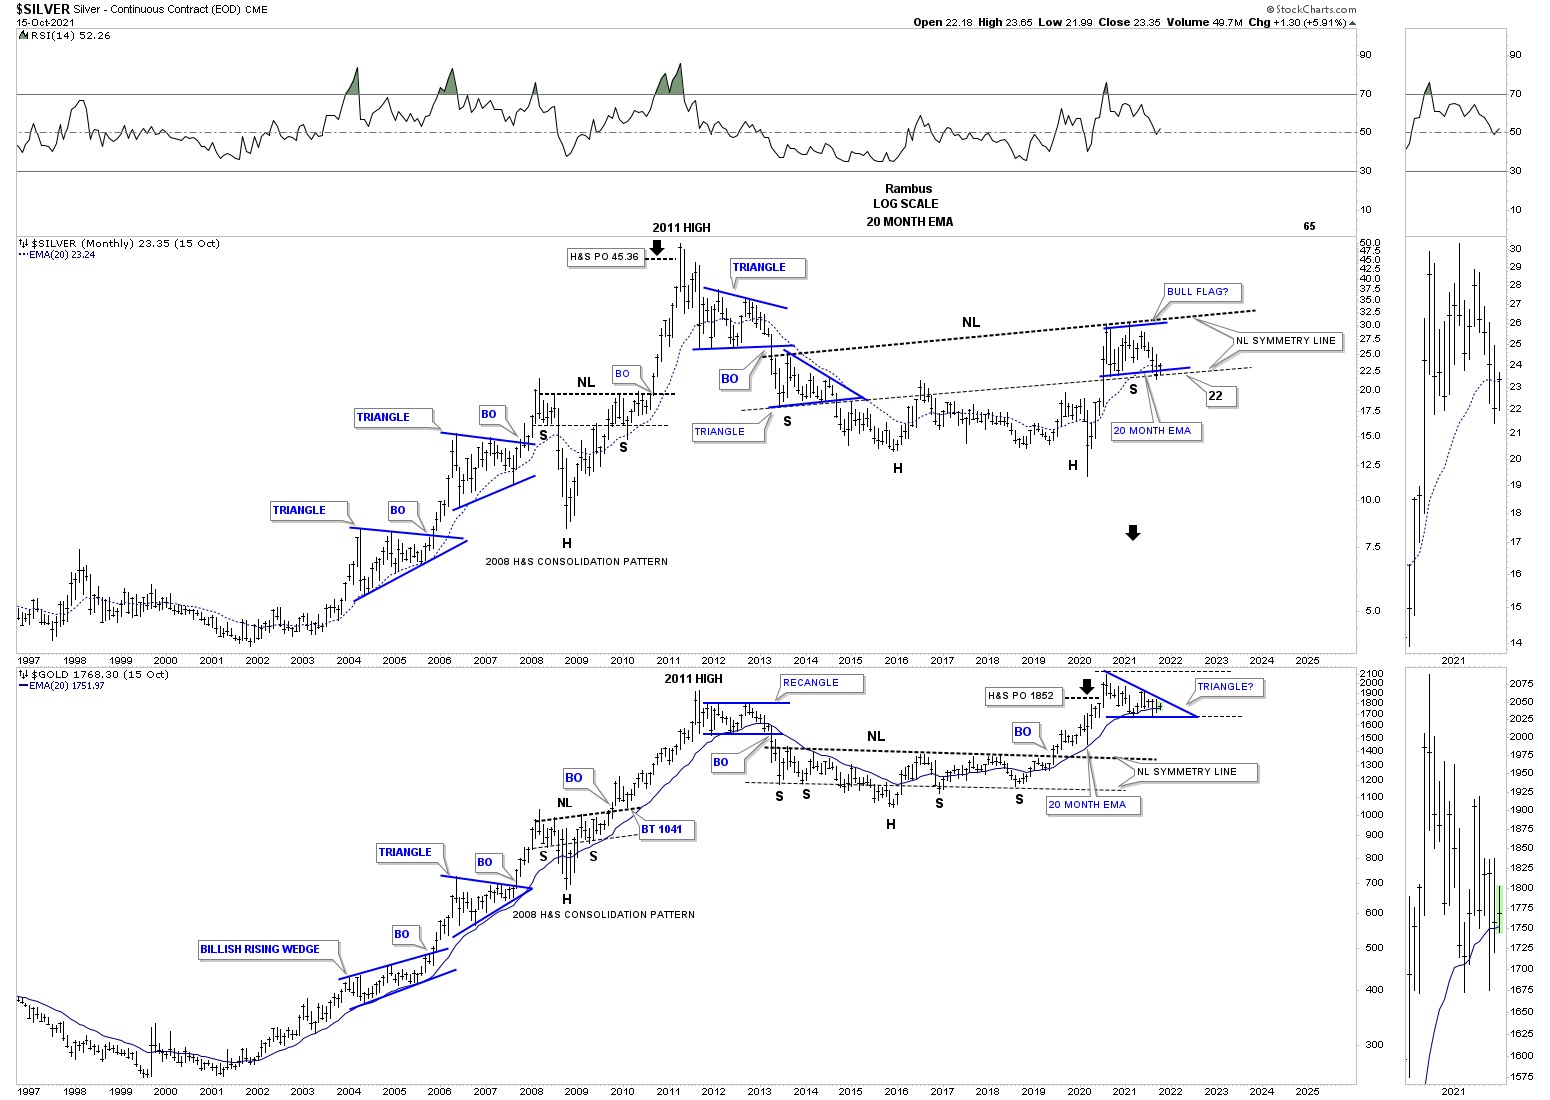
Below is a combo chart which shows the secular bull markets for Silver and Gold which we’ve been following for close to a year now since the price action hit the neckline symmetry line on Silver. As you can see Gold has been leading Silver as it broke out from its massive H&S base much earlier than Silver. Silver is now in its second month of looking for the right shoulder low of its massive H&S bottom around the 22 area. From a Chartology perspective this is a pretty as it gets.

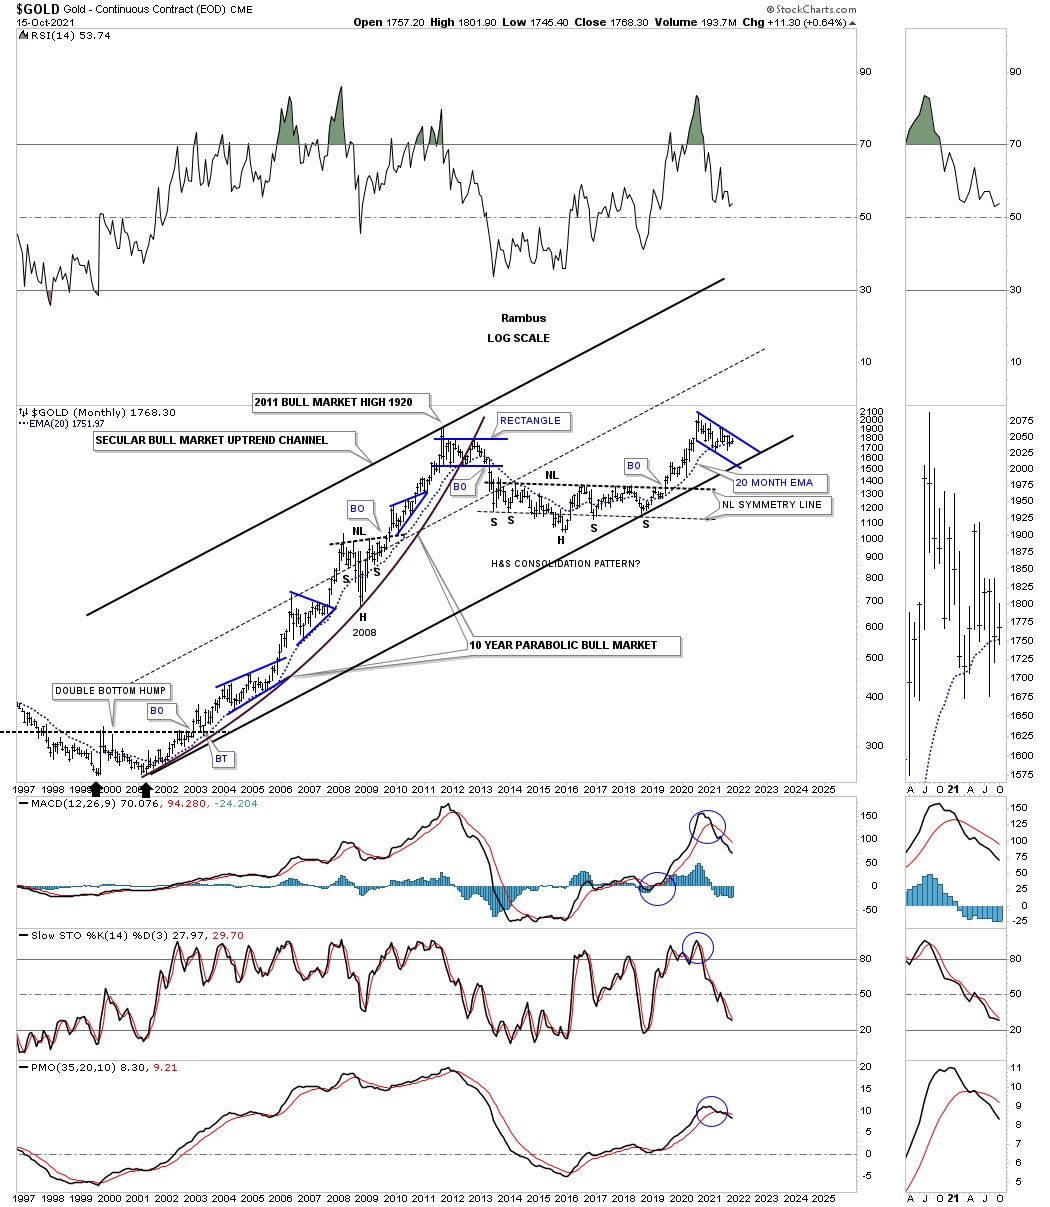
This last chart for tonight shows Gold’s secular bull market that began at the double bottom low in 2000. So far the 20 month ema has held support just like it did during the bull market years except for the 2008 crash which at the time was very painful if you were holding PM stocks but in the big picture it doesn’t look that bad.
Gold is currently testing its 20 month ema which if history is any guide then this should be a great buying opportunity. We have to wait for the end of the month of trading to see where Gold closes the month of October. Hopefully Gold will be trading above its 20 month ema and all will be right with the world once again. All the best…Rambus

Let's take it one step further to try and find where Gold is currently trading vs the initial breakout move above the double bottom trendline that was made at the 2000 low. Keep in mind fractals are never exact duplicates of each other. As long as they are following the script fairly closely you can have minor divergences and not hurt the fractals.
This is the exact same chart as the one above but this time I’m using the red squares to compare where Gold is currently trading vs the initial breakout move above the double bottom trendline in October of 2002. As you can see price wise Gold has reached the same height as the initial rally after the breakout from the double bottom trendline as shown by the red squares. Time wise it looks like Gold could have a few more quarters of backing and filling before it breaks out to new all time highs if this possible fractal look at gold plays out exactly like the 2000 low. The high Gold made in 2020 if equivalent to where Gold was trading back in October of 2005 which left another 6 years before Gold actually topped out and began it consolidation phase, you are here green arrows.

Below is a combo chart which shows the secular bull markets for Silver and Gold which we’ve been following for close to a year now since the price action hit the neckline symmetry line on Silver. As you can see Gold has been leading Silver as it broke out from its massive H&S base much earlier than Silver. Silver is now in its second month of looking for the right shoulder low of its massive H&S bottom around the 22 area. From a Chartology perspective this is a pretty as it gets.
This last chart for tonight shows Gold’s secular bull market that began at the double bottom low in 2000. So far the 20 month ema has held support just like it did during the bull market years except for the 2008 crash which at the time was very painful if you were holding PM stocks but in the big picture it doesn’t look that bad.
Gold is currently testing its 20 month ema which if history is any guide then this should be a great buying opportunity. We have to wait for the end of the month of trading to see where Gold closes the month of October. Hopefully Gold will be trading above its 20 month ema and all will be right with the world once again. All the best…Rambus
*********
 Meet Rambus, a seasoned trader and technical analyst renowned for his unbiased and insightful chart work. Through his website, Rambus Chartology, and Substack newsletter, Rambus shares his expertise with a global community of subscribers, providing daily updates, commentaries, and hands-on training in the art and science of chartology. With his calm, humble, and down-to-earth approach, Rambus demystifies complex market trends, helping his followers navigate the challenges of today's volatile markets. Join the Rambus Chartology community today and discover a unique blend of technical analysis, trading expertise, and time-tested protocols. Subscribe now at www.rambus1.com or https://rambuschartology.substack.com/
More from Gold-Eagle


