Gold Is Up $300 Since November - So What?!


GOLD IN THE HEADLINES
Advisors and marketers are ecstatic:...
"Nothing will be able to stop gold when it breaks to a new all-time high" or "On the cusp of a breakout where gold can go up to $5000" are two examples of recent exclamations about prospects for higher gold prices. The euphoria can be contagious.
I'm sure that makes gold bulls feel optimistic. After all, they have been passengers on an amusement ride that wasn't what they expected. After being strapped in for a rocket launch, they found themselves on a roller coaster that was in the midst of a downward descent.
SIGNIFICANCE OF GOLD PRICE INCREASE
What is the significance of gold's recent price spike? Below is a chart of gold prices for the past year...
Chart No. 1 : Gold Prices - 3 Year Historical Chart
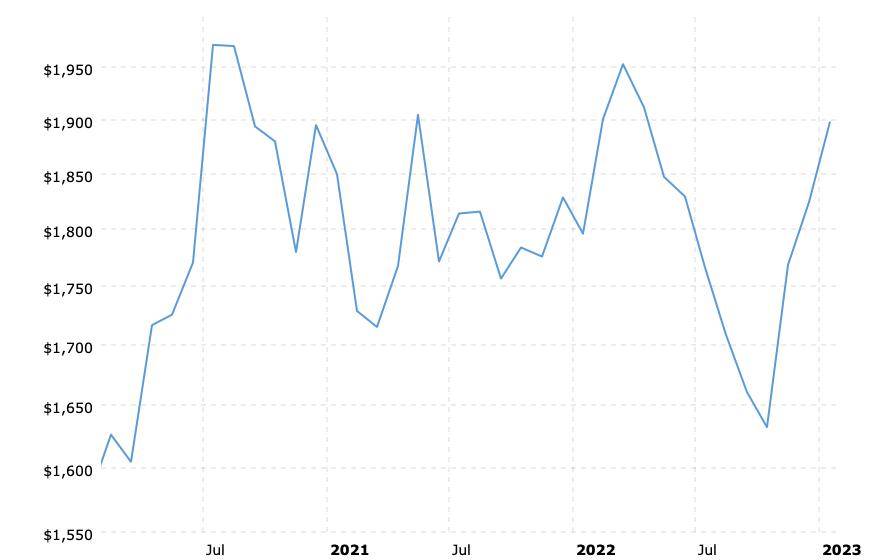
Just prior to its recent price increase, gold had fallen $417 oz. from a high of $2043 to a low of $1626. In February 2020, barely three years ago, the price of gold was exactly the same - $1626.
February 2020 was just before the Covid pandemic. Since then we have experienced (in addition to the pandemic) a collapse and recovery in the financial markets, a global recession, war between Russia and Ukraine, the highest CPI numbers in four decades, higher interest rates and another collapse in financial asset prices. Net of all this, the price of gold at $1626 oz. was right back where it started.
At its current price of $1895 oz., gold is exactly where it was two years ago at the end of 2020. For the past three years gold has closed out each year as follows: $1895, $1828, $1824.
Like riding a roller coaster, gold investors keep returning to the starting point.
Some additional perspective is helpful. Below is the same chart as above EXCEPT that the prices are adjusted for the effects of inflation...
Chart No. 2: Gold Prices (inflation-adjusted) - 3 Year Historical Chart
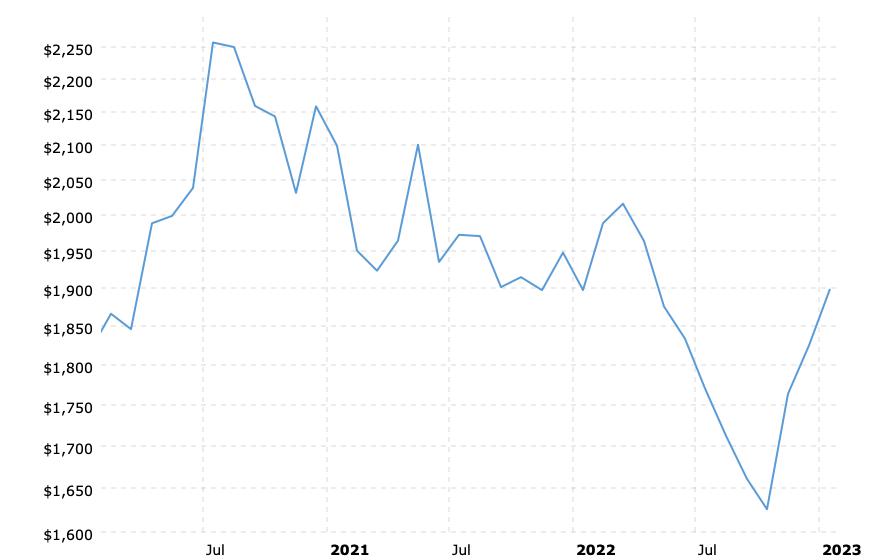
Chart No. 2 paints a different picture from that seen in Chart No. 1. In real (inflation-adjusted) dollars, the price of gold is in a steep decline dating back to July 2020. At its recent low of $1626 oz., the gold price was down $700 oz. or forty-three percent.
PRICE OF GOLD IN 2009
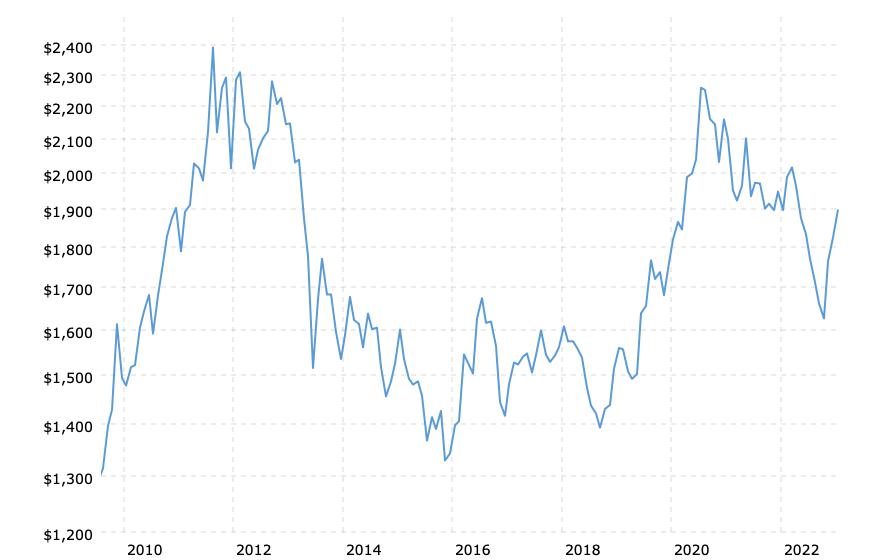
In November 2009, the price of gold was $1175 oz. After adjusting for the effects of inflation that have occurred since then, the corresponding price in today's dollars is $1613 oz. which is at or near where gold traded just two months ago in November 2009.
Again, back to its starting point. Here is what that looks like on our final chart...
Chart No. 3: Gold Prices (inflation-adjusted) - 13 Year Historical Chart
SUMMARY AND CONCLUSION
The price of gold is currently in a steep decline dating back to its high in August 2020. There is little or no justification for the expectation that gold will break upwards to new highs anytime soon. More likely, investors can expect a resumption of the downtrend and an eventual break to new lows below $1600 oz. (also see Demand For Gold - No New Highs and Gold And The Normalcy Bias)
Kelsey Williams is the author of two books: INFLATION, WHAT IT IS, WHAT IT ISN'T, AND WHO'S RESPONSIBLE FOR IT and ALL HAIL THE FED!
********


