Gold Above $1,400 Is Only The Tip Of The Signal Iceberg


Gold broke above the $1,400 level last week and the volume that corresponded the move was exceptional. The story doesn’t end there. The volume for silver was big and the volume for silver stocks was truly epic. Something very, very, very important is happening right now. You knew a part of the story for weeks now… And the last week seems to have written its conclusive verse.
What is it that you knew about in advance? The reversals! It’s the final part of June and that’s when long-term triangle-vertex-based reversals were supposed to take place. Based on indications that we had available weeks ago, it seemed more likely that we will see a decline and an interim bottom at this time. However, based on the relatively chaotic political and monetary announcements of the recent past, the precious metals sector moved higher. Silver moved rather insignificantly so, but still, the move was visible, and we can say that they all (gold, silver, and mining stocks) moved higher recently. This means that all triangle-vertex-based reversals should be interpreted as strong indications of a top. Strong, because they confirm each other based on entirely different price patterns. Let’s take a look below for details.
The Reversals
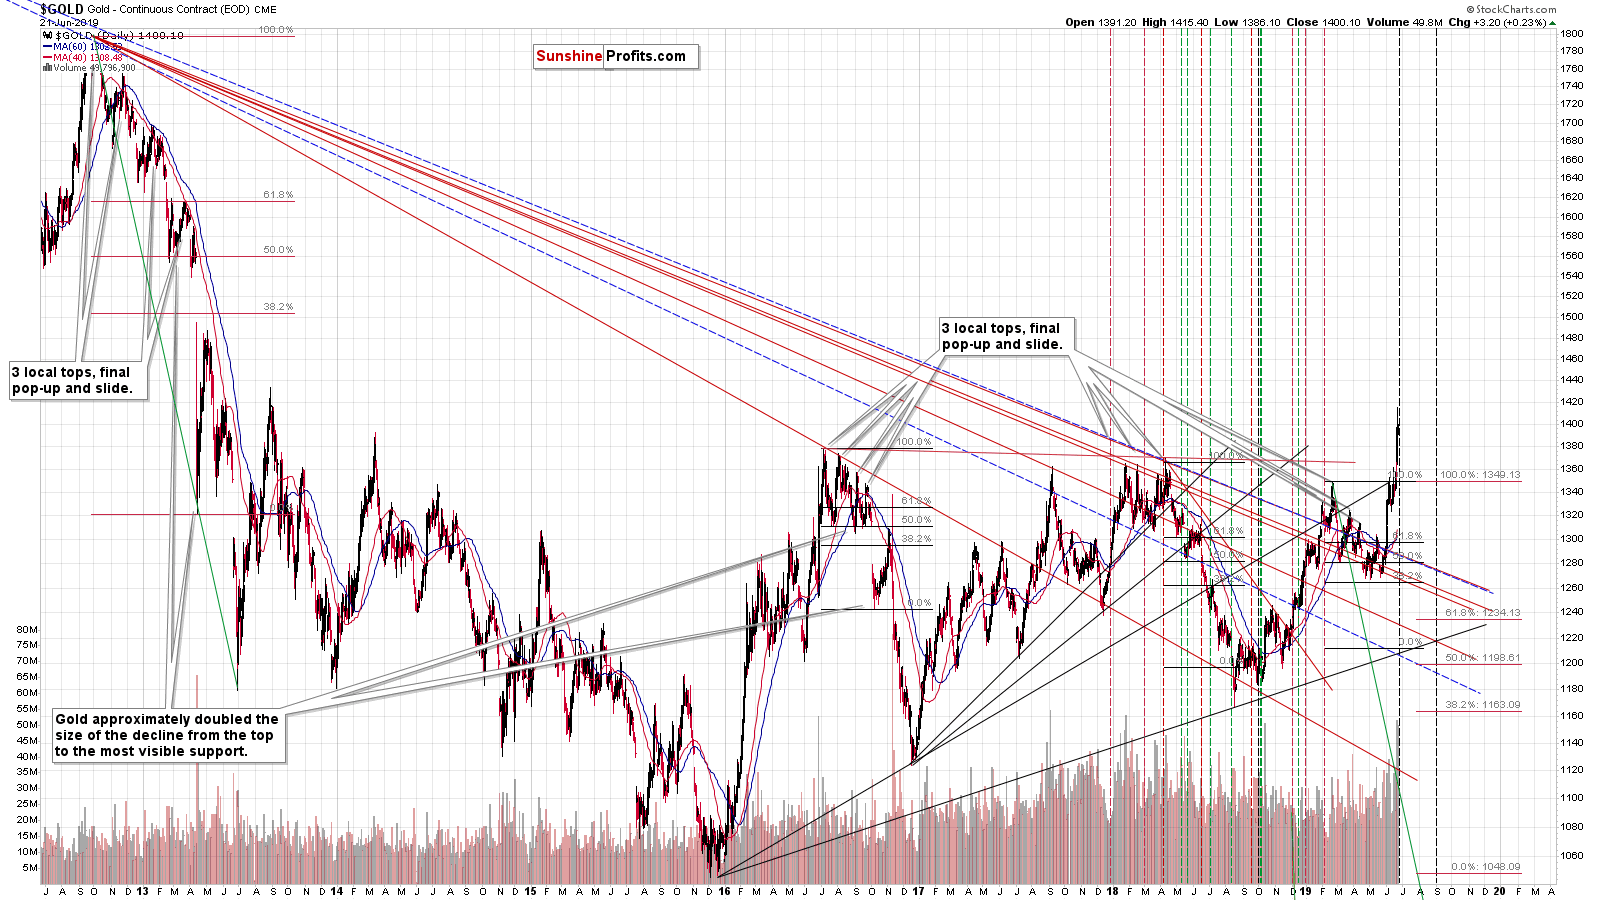
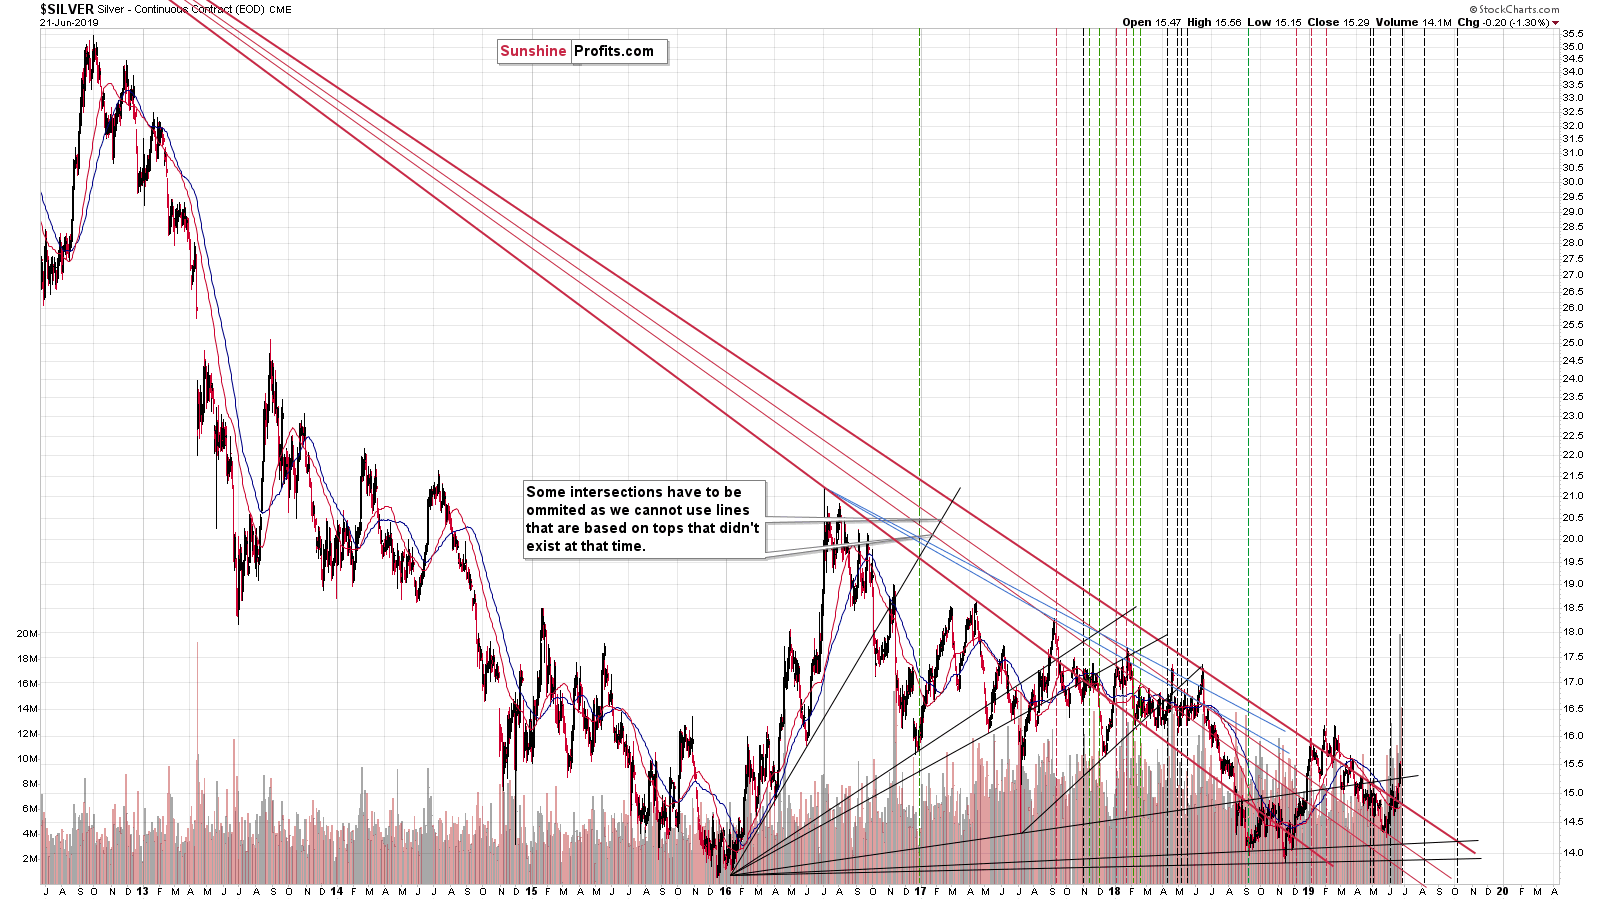
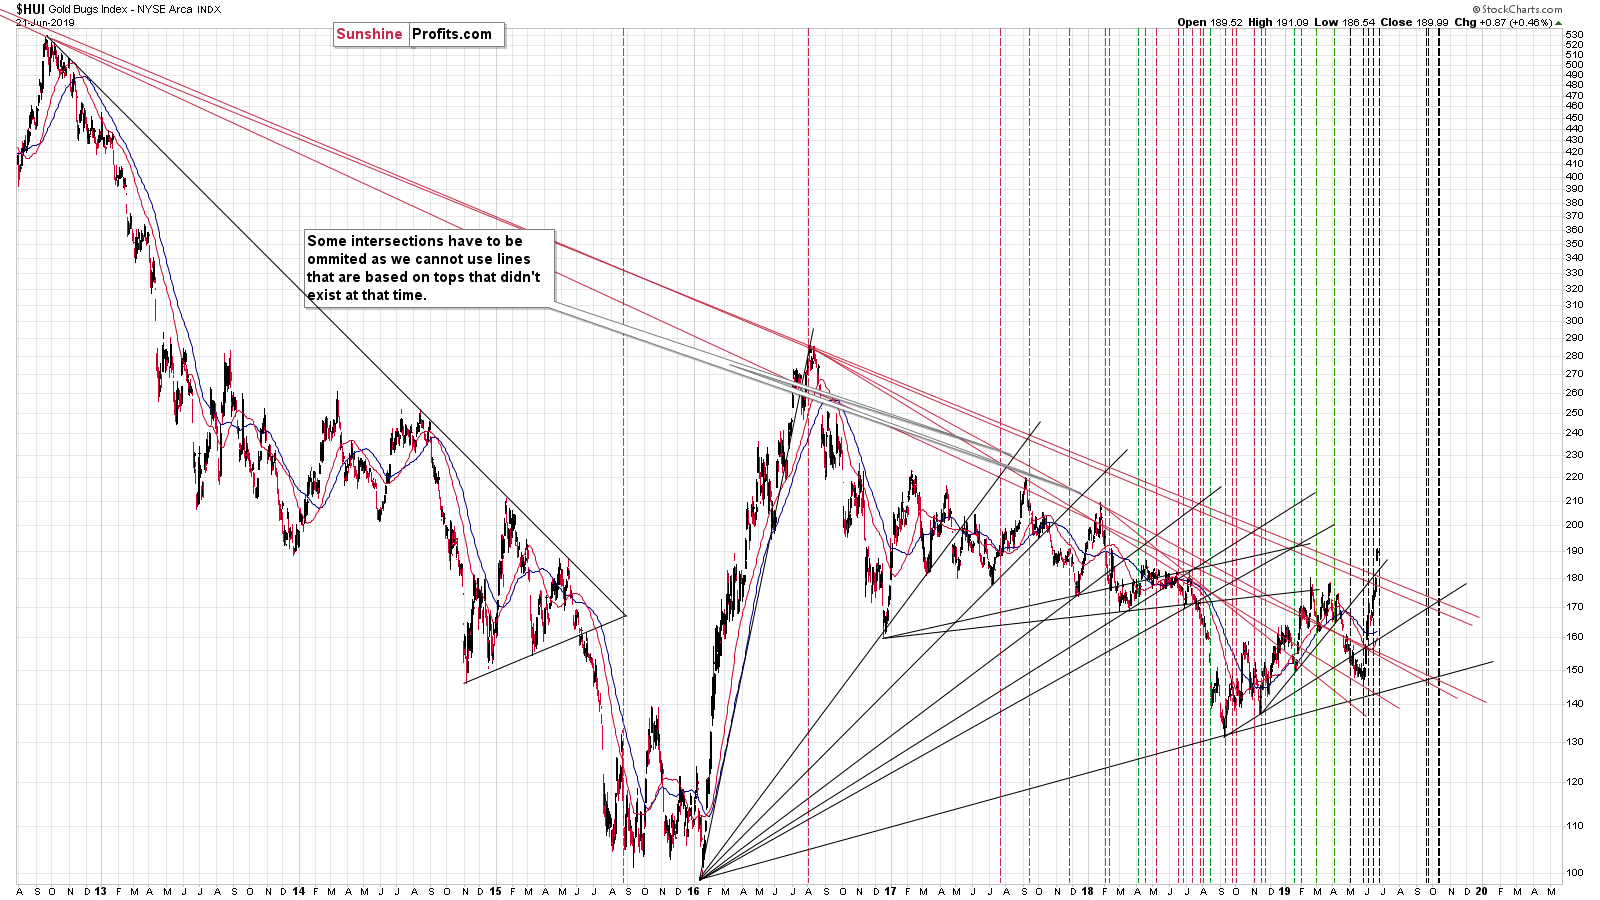
In all cases we see a reversal based on triangles that are created using very long-term support and resistance lines. This is the only reversal that we have can see in the next several months that is confirmed by all 3 above-mentioned markets. This – on its own – is a very good reason not to take gold’s and miners’ recent rally on its face value.
There are quite many additional reasons not to do so, and their big share is based on volume. Extremely high volume usually means extremely high emotions. And what do extremely high emotions accompany? Extreme tops and extreme bottoms. The most recent short-term move has definitely been up, so it can’t be a bottom. This leaves us with the top scenario. As is the case with the above-mentioned reversals, the more confirmations from different markets we get, the more reliable this indication becomes.
And where did we see it?
For instance, in gold where we saw the second-biggest weekly volume reading in case of weekly rallies, but we’ll leave the discussion of this market to our subscribers. The full version of today’s analysis also includes the details regarding senior mining shares,and in the free version that you are reading ,we will focus on the silver market.
The Multitude of Silver Signs
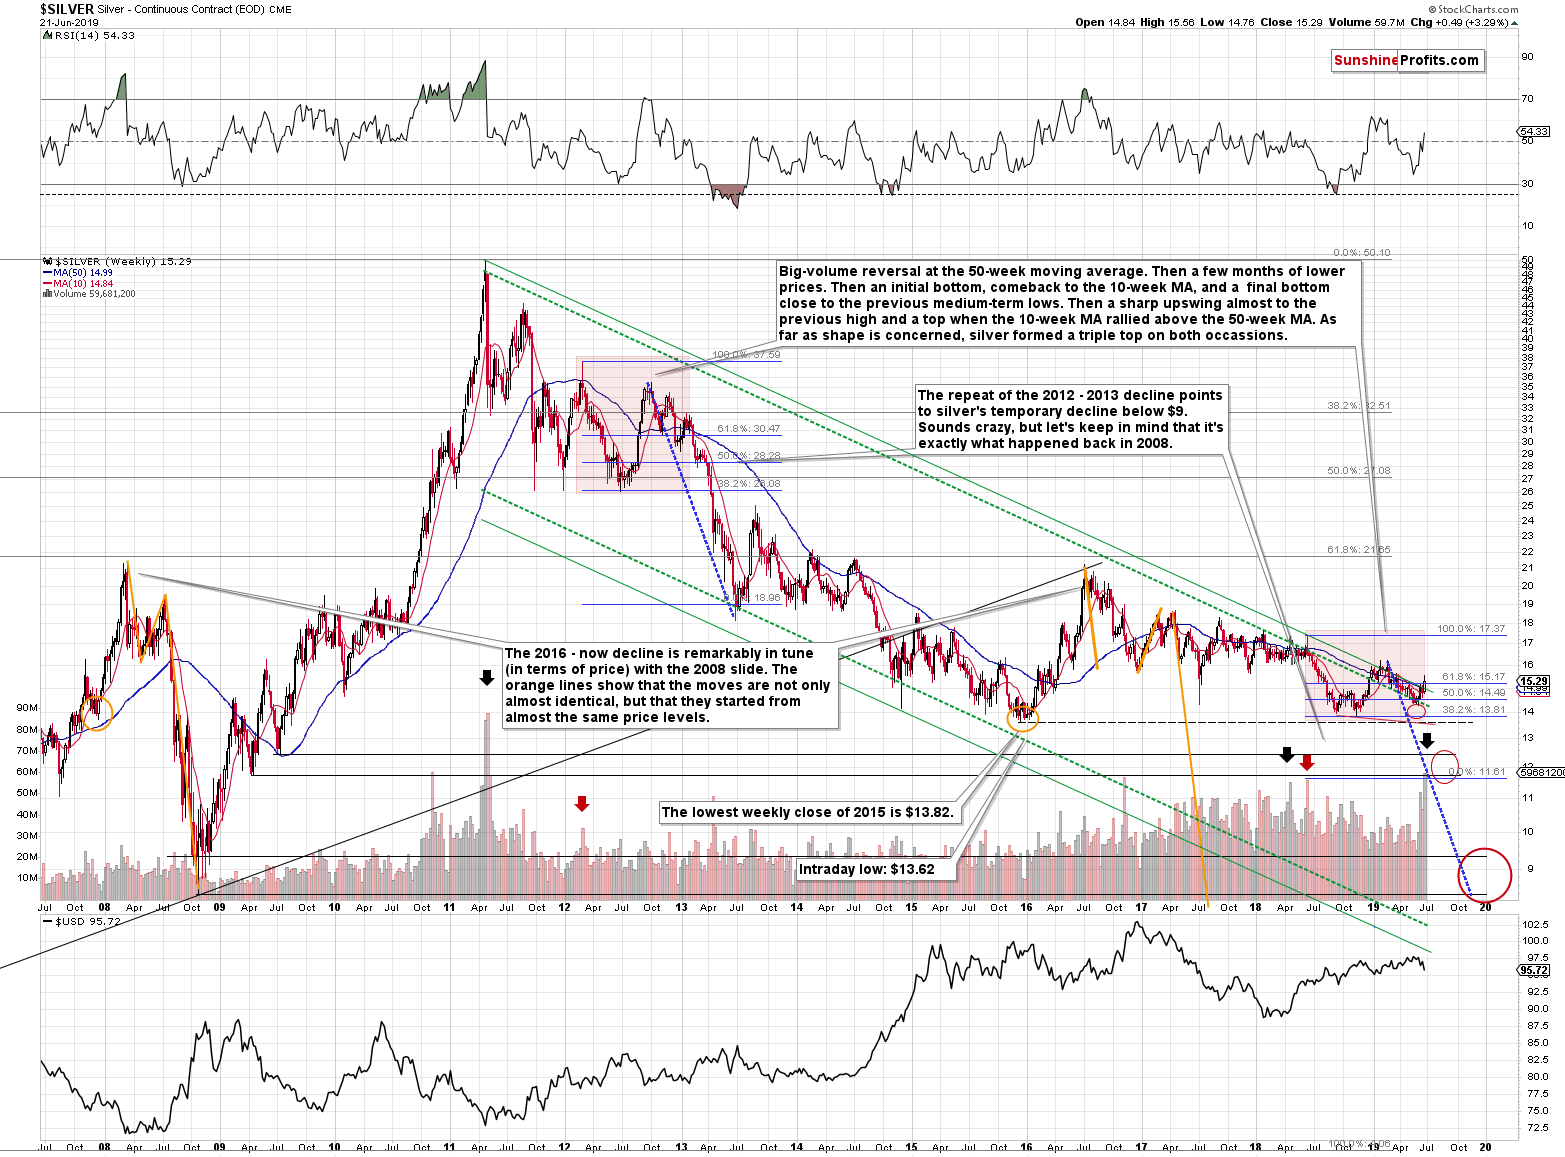
Last week’s volume in silver was also the second biggest when taking the weekly rallies into account. Except for the biggest weekly volume reading (the 2011 top), there was one additional similar weekly volume reading. It was in April 2018, close to silver’s 2018 high. Both times (we marked them with black arrows) were extremely favorable shorting opportunities and one of the worst moments to make silver investments.
There are also red arrows on the above chart that mark the beginning of the silver self-similar pattern that is also marked using the red area on the price chart. The recent rally in gold made the analogy to the 2012-2013 decline rather unclear, but it remains perfectly intact in case of silver, which is not as easily influenced by Twitter politics. What we saw in silver recently, was a relatively small rally when compared to the 2019 decline. That’s very similar to what we saw in early 2013. Both silver moving averages: the 10- and 50-week ones are declining, and this corrective upswing took silver a bit above them. The same thing happened in early 2013. Many people thought that the worst is over, and that silver will keep on rallying from that point. Instead, we have never seen higher silver prices since that time. In fact, the white metals’ price was more than cut in half.
The biggest shocker as far as volume is concerned came from the silver mining stocks.
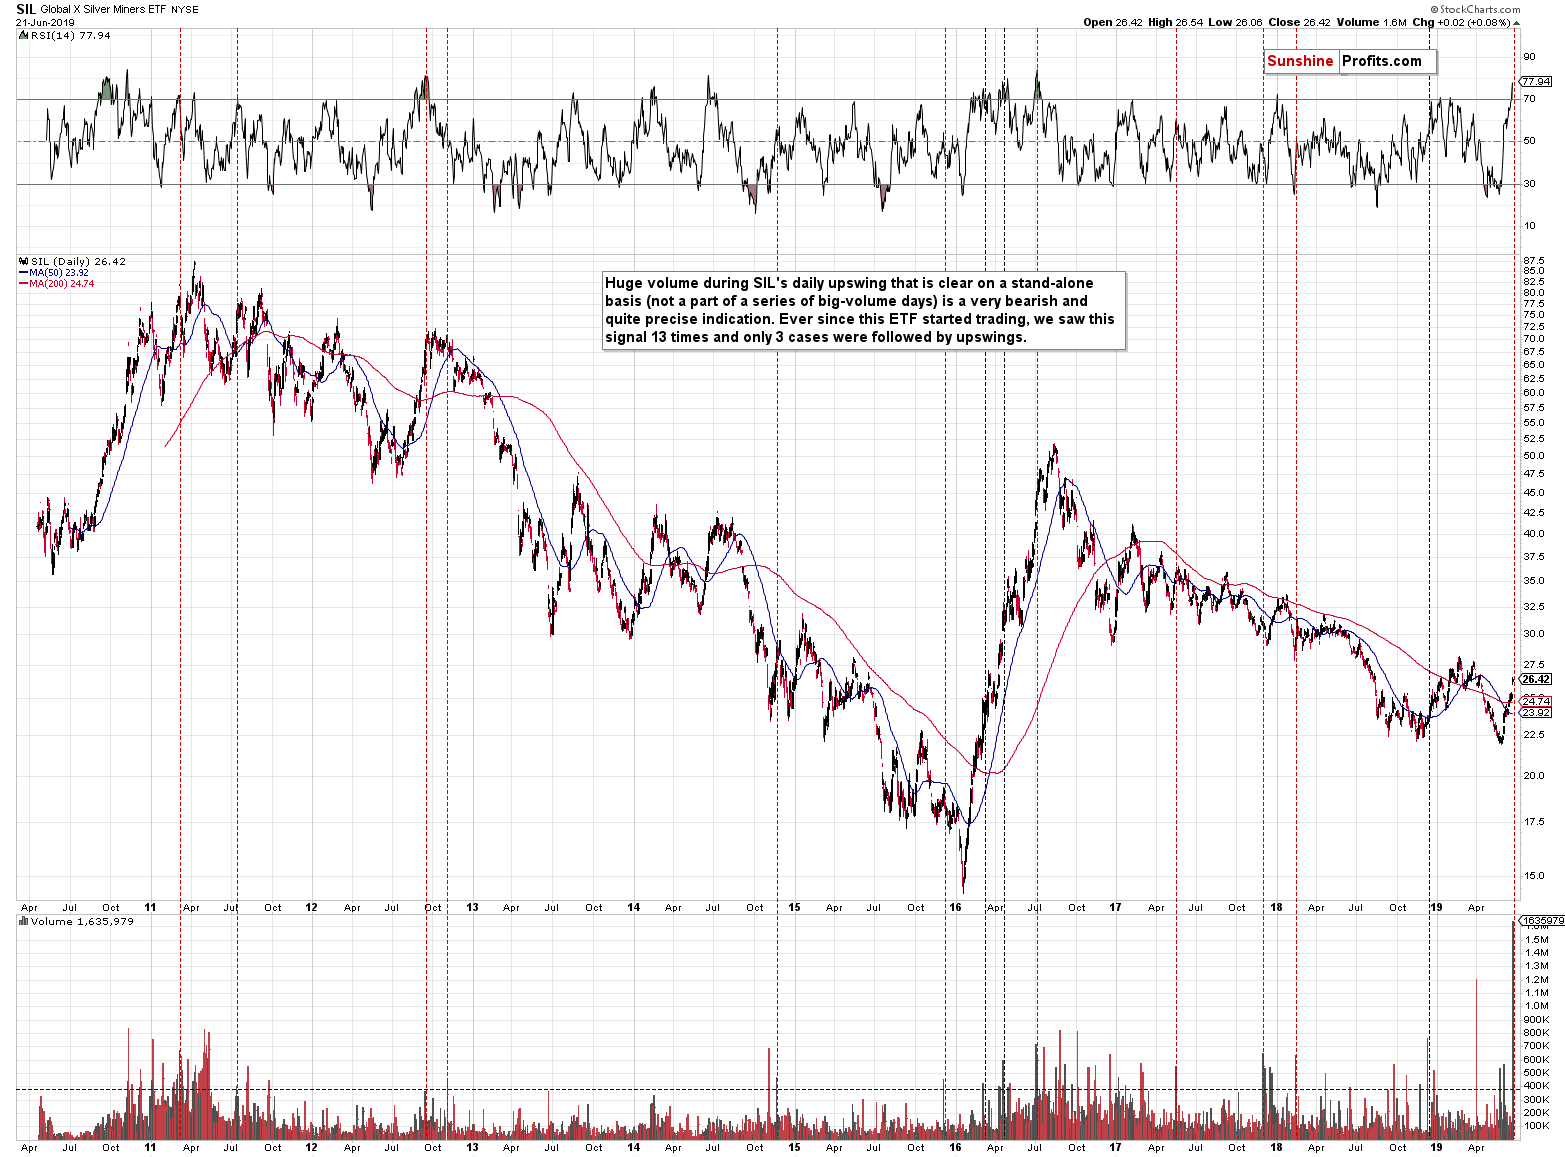
Friday’s SIL (silver stock ETF) volume was truly breathtaking. It was the biggest volume ever and if we take only the daily rallies into account it was more than twice as big as the second biggest value. And what did SIL do on Friday? It moved back and forth, while closing almost unchanged, thus creating a doji candlestick. Doji after a rally and accompanied on huge volume is a sign of reversal. This, accompanied by very overbought status as indicated by the RSI has profoundly bearish implications going forward.
Let’s stay with silver for a while. Did you realize that despite gold’s volatile movement, the white metal has been very… boring?
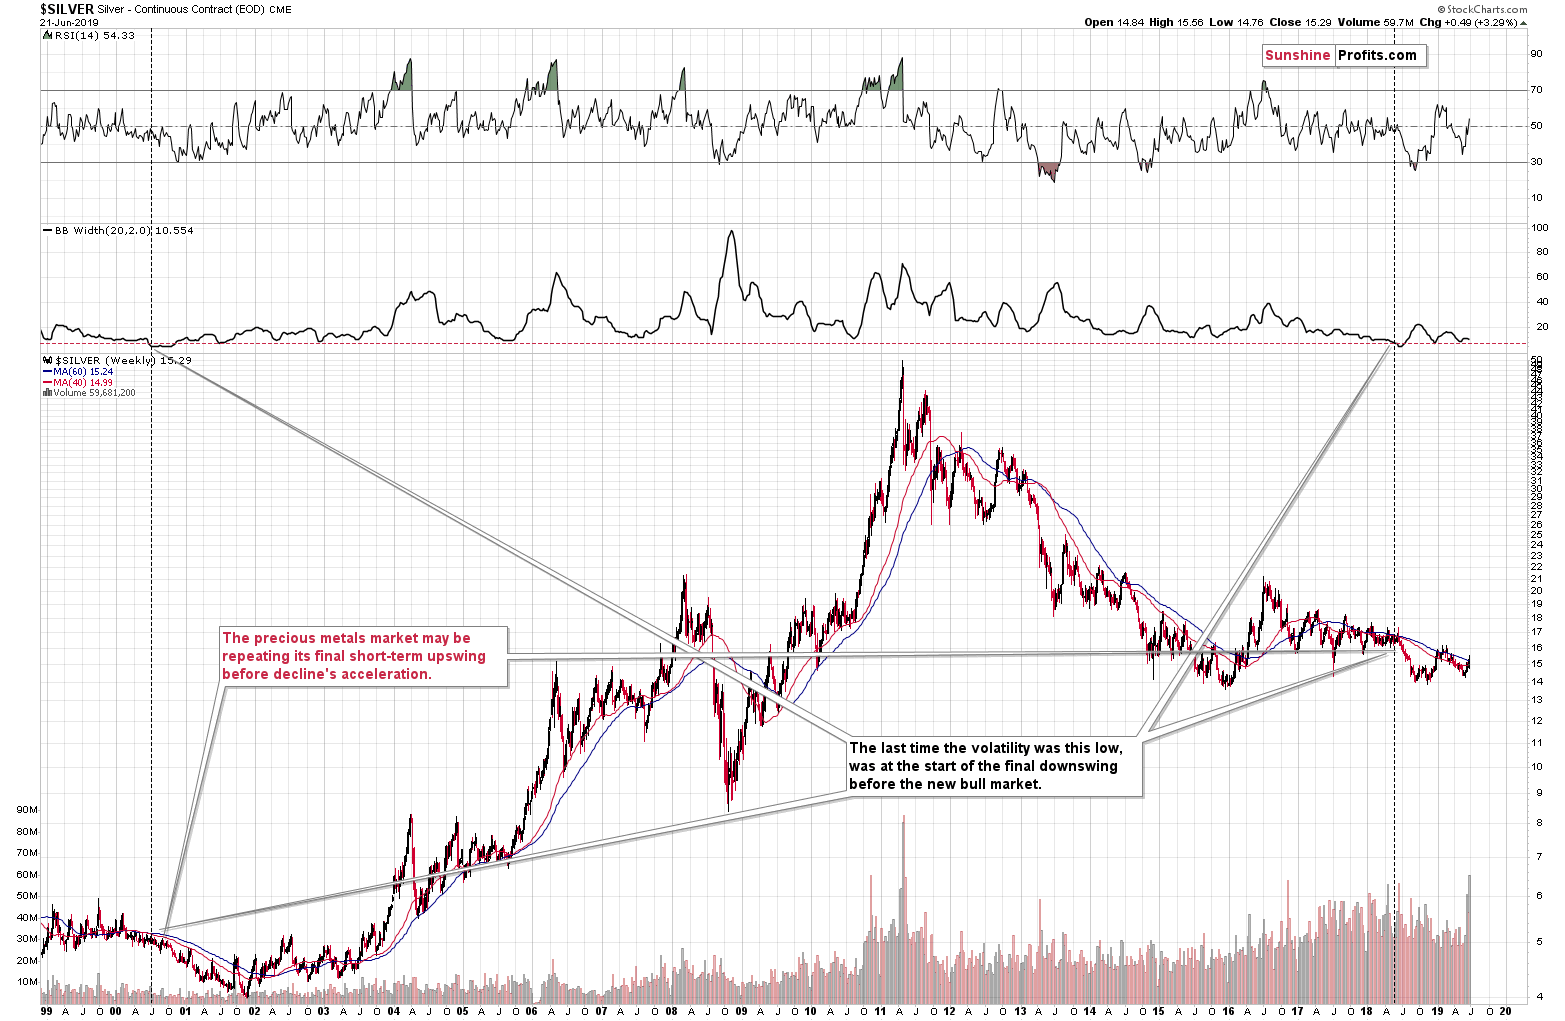
The indicator that is visible on the above chart second from top is the width of the Bollinger Band. It’s a proxy for the market volatility. Please note how the moves in silver (especially upswings) became smaller over time. It came to the point when gold moved above its 2016 high, while silver is relatively close to the 2015 bottom.
The key question is when was silver just as boring (calm) and when did it take place for as long as it’s been taking place right now. The answer is that it was the case about 20 years ago right before silver’s slide to its final bottom. This analogy continues to favor the scenario in which we get lower precious metals values and the true bottom after a several-month-long decline.
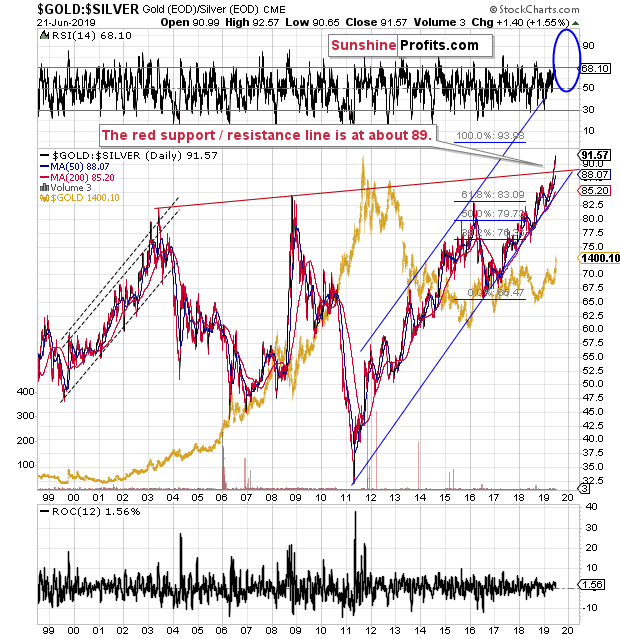
Meanwhile, the gold to silver ratio continues to soar, suggesting that the true bottom for the precious metals sector is not yet in. We have been emphasizing that for weeks, even though multiple gold promoters insisted on ignoring this fact and suggesting that the ratio reached some kind of long-term resistance. It was not only reached – it was breached, and the implications are very bearish, as the biggest moves in the precious metals sector tend to take place in the opposite direction to the one in which this important ratio is moving.
Summary
Summing up, the gold-silver ratio, silver itself, and many factors that we covered in the full version of today’s analysis all suggest that the most recent move higher in the precious metals sector is nothing more than just a corrective upswing within a bigger trend. It is only gold price itself that can make one wonder if gold has truly broken out and that it will now continue to soar. This is doubtful, because this strength is not confirmed, as it happened right after a series of rather chaotic and surprising news. Adding extremely positive sentiment as confirmed by volume across the precious metals board and the very strong triple vertex-based reversal indication makes the outlook for gold much less bullish that everyone and their brother would have you believe. Please note that we are not “married” to the bearish outlook for gold and we will return to viewing the medium-term outlook as bullish, but not until the cold analysis suggests that the tables have indeed turned. This is not the case right now – please look at today’s charts for details. In particular, it’s a bad idea to adjust one’s outlook just because many people got excited. The excitation itself is a sign of a turnaround, not something to take at the face value.
Today's article is a small sample of what our subscribers enjoy on a daily basis. They know about both the market changes and our trading position changes exactly when they happen. Check more of our free articles on our website, including this one – just drop by and have a look. We encourage you to sign up for our daily newsletter, too - it's free and if you don't like it, you can unsubscribe with just 2 clicks. You'll also get 7 days of free access to our premium daily Gold & Silver Trading Alerts to get a taste of all our care. Sign up for the free newsletter today!
Przemyslaw Radomski, CFA
Editor-in-chief, Gold & Silver Fund Manager
Sunshine Profits - Effective Investments through Diligence and Care
* * * * *
All essays, research and information found above represent analyses and opinions of Przemyslaw Radomski, CFA and Sunshine Profits' associates only. As such, it may prove wrong and be a subject to change without notice. Opinions and analyses were based on data available to authors of respective essays at the time of writing. Although the information provided above is based on careful research and sources that are believed to be accurate, Przemyslaw Radomski, CFA and his associates do not guarantee the accuracy or thoroughness of the data or information reported. The opinions published above are neither an offer nor a recommendation to purchase or sell any securities. Mr. Radomski is not a Registered Securities Advisor. By reading Przemyslaw Radomski's, CFA reports you fully agree that he will not be held responsible or liable for any decisions you make regarding any information provided in these reports. Investing, trading and speculation in any financial markets may involve high risk of loss. Przemyslaw Radomski, CFA, Sunshine Profits' employees and affiliates as well as members of their families may have a short or long position in any securities, including those mentioned in any of the reports or essays, and may make additional purchases and/or sales of those securities without notice.
********
 Przemyslaw Radomski, CFA, is the founder, owner and the main editor of SunshineProfits.com. You can reach Przemyslaw at: http://www.sunshineprofits.com/help/contact-us/.


