Gold and its Open Interest


The Dow Jones was up for the week by 126 in dollars, or 0.34% in BEV terms in the chart below. Making a close above its’ BEV -5% line, or closing in scoring position as far away this week as it was last week. If you’re a bull on the stock market, seeing the Dow Jones close in scoring position is a big deal. Why that is can be seen in the Trump and Not QE#4 rallies noted below.
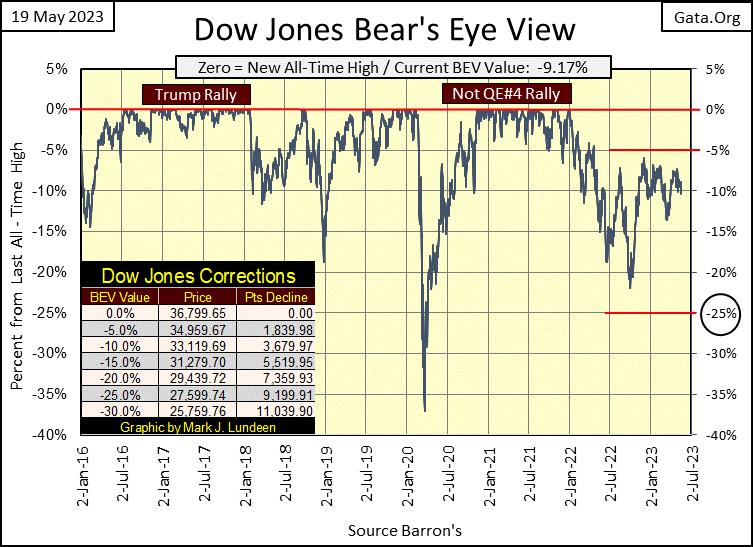
In these two bull market advances, once the Dow Jones closed in scoring position, a BEV of something less than -5.0%, that is when the Dow Jones began making new BEV Zeros, new all-time highs, or 0.0% in the BEV chart. Both these advances lasted a couple of years, and during these advances, seeing the Dow Jones BEV fail to make a new 0.0% (new all-time high), but remain above its BEV -5.0% line, one could assume the market rally was only correcting, with more BEV Zeros to follow. Once the Dow Jones closed below scoring position (below -5.0%) this was a good indication the best of what this advance had to offer had passed, if not completely over.
Currently, as I read the BEV chart above, I see the Dow Jones broke below its BEV -20% line at the end of September, which triggered a nice rebound in the market. But for the past eight months, though the Dow Jones has tried, it has failed to break into scoring position, making the current advance off last September’s low, very much a lame one. Of course, I could change my opinion on the market, should the Dow Jones close with a BEV of -4.99% or lower, with a few BEV Zeros (0.00%) to follow.
However, that is just for the Dow Jones. What about the rest of the market, the other major market indexes people follow? As seen in the table below, listing the major market indexes’ BEV values, none of them are in scoring position. Far from it, so they also aren’t looking good. At week’s close, most were far away from closing with a BEV of -4.99% or less.
What a difference from the week of November 05 2021, when out of the possible 100 daily closes seen below, 63 of the daily closes were 0.00% (new all-time highs), with everything else, except for the XAU, deep in scoring position, below -5.00%. Compare that to what we see below, for the former NASDAQ glamor stocks and the hot issues trading in the Russell 2K, having deflated by over 20% from their highs of eighteen months ago.
And then there are the banks trading in the NASDAQ Banking index. A year and a half ago, this banking index was a high flyer, with daily closes in scoring position and BEV Zeros as far as the eye could see. But what do my eyes see at this week’s close for these banks? They have replaced the XAU as Tail-End Charlie at #21 in the table, for the third week in a row.
With a market like this, should the Dow Jones (#2 below) see a new all-time high, with everything else trading so far below their last all-time highs, would that even be bullish? I don’t think so.
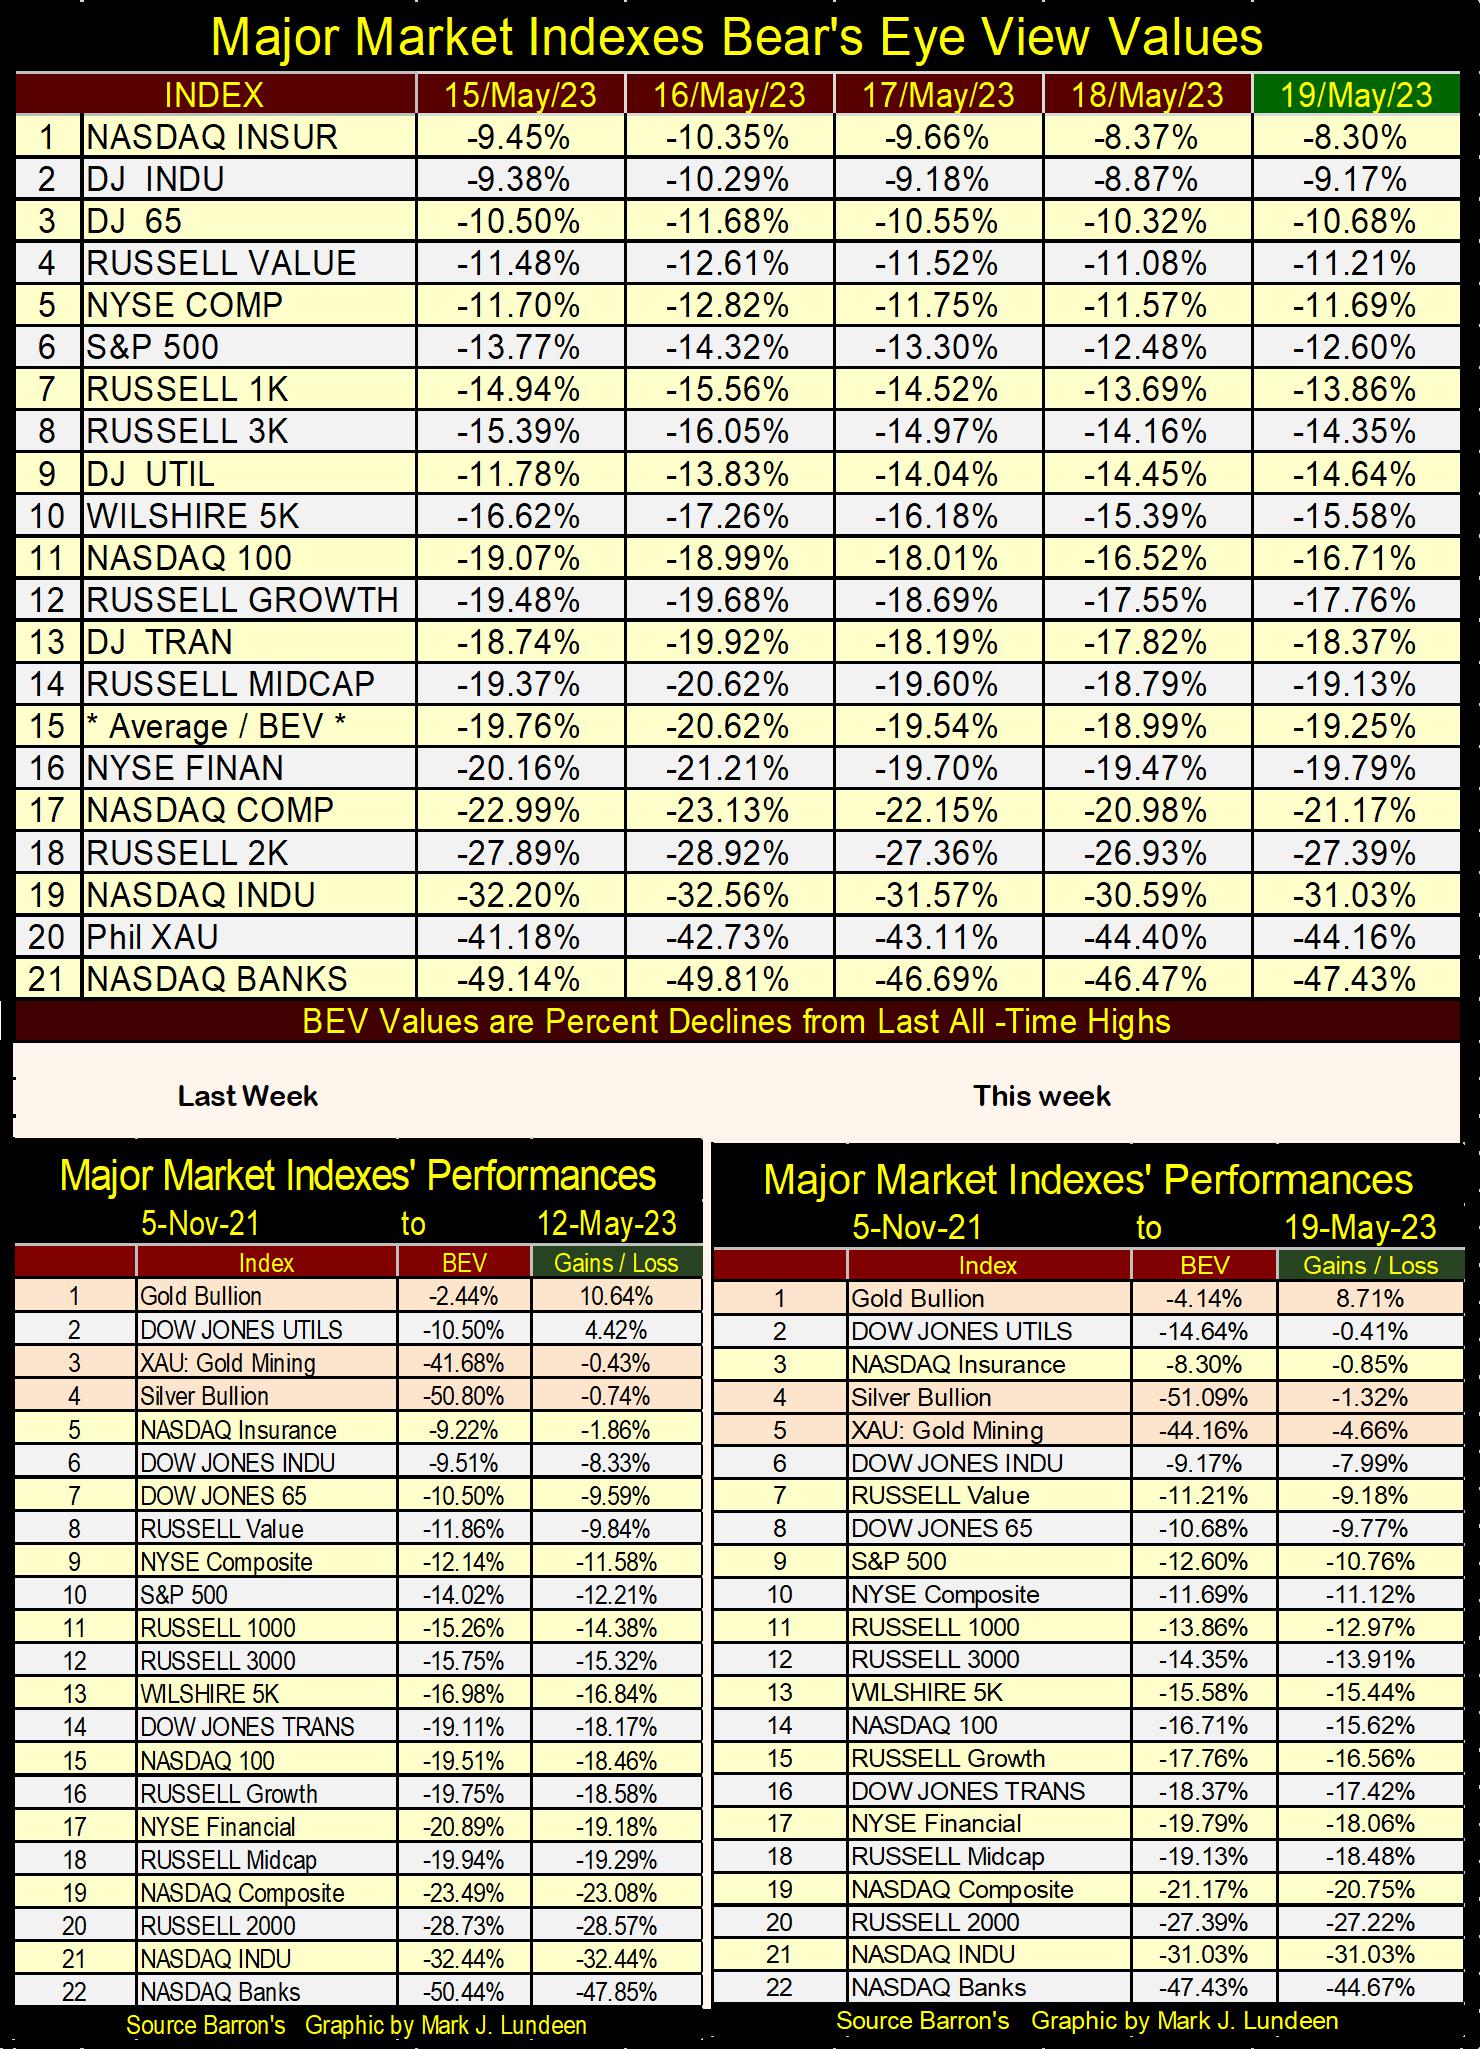
In the market’s performance tables above, gold, silver and the XAU have slipped a little from last week, but they remain at the top of the table.
Let’s look at the bond market, a major reason the stock market is having such difficulties since the Dow Jones’ last all-time high of 04 January 2022, with the Dow Jones Bond Index’s price chart below.
The first item of interest is how the valuation of these bonds deflated a whopping 15% from March 4th to March 18, only ten trading sessions, during the March 2020 flash crash.
A major reason the idiots at the FOMC began “injecting” trillions and trillions of inflationary dollars (“liquidity”) into the market three years ago, was the corporate bond market was in melt-down mode, as seen below. Fed Chairman Powell announced that for the first time in the Federal Reserve’s history, they were going to purchase (monetize) corporate bonds.
With this artificial demand from the FOMC, corporate bond valuations began inflating once again, and I’m assuming that is why there wasn’t a banking crisis in 2020.
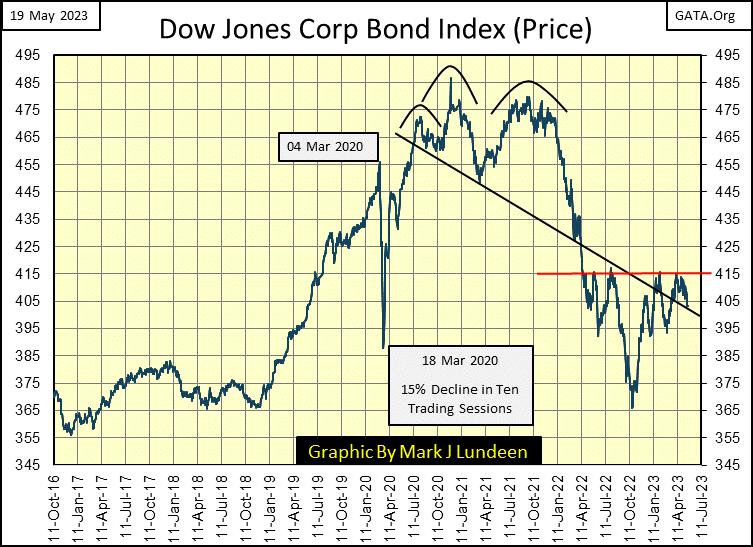
And all was well, until bond valuations once again began deflating (bond yields rising) in January 2022. And when did the banking system the Federal Reserve regulates begin seeing runs on their deposits? I believe it was around the time the valuation for these corporate bonds bottomed last autumn, about a 24% decline in these bond’s valuation from the year before.
The problem was, and remains; banks were taking dollars from their depositors’ deposits, and purchasing bonds, such as these corporate bonds. It’s what banks do; make money off funds deposited in them by the public. It was no different with Treasury bonds. In the chart below, rising bond yields, deflating bond prices, shaved 25%, or more from the market valuations of reserves backing public deposits in the banking system.
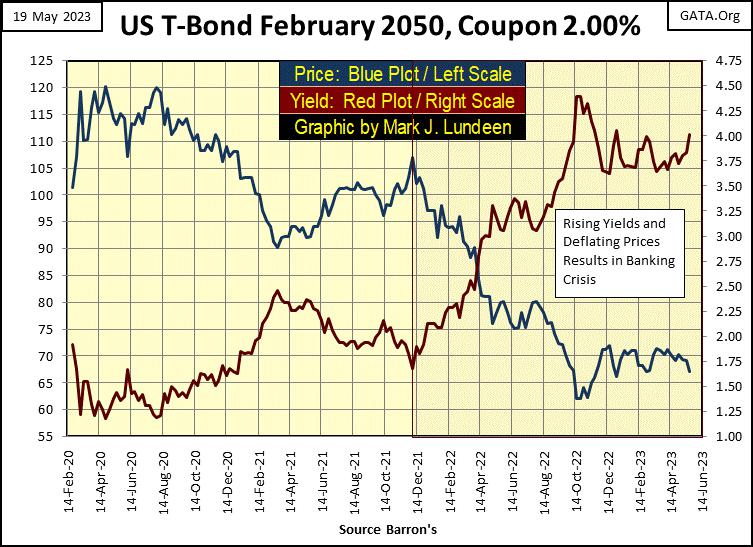
That bond valuations remain far below their highs of January 2022, suggest the current crisis in banking, and bear market in stocks and bonds are far from over. When bond yields once again begin advancing towards much higher levels, and bond valuation deflate to levels not currently believable, Wall Street, and the banking system are going to have big problems.
But that wasn’t so for the Dow Jones this week, as it creeped upwards from last week’s close in its daily bar chart below. The Dow Jones last all-time high was 36,799 from its January 4th 2022 close. For the past six months seen in the chart below, 34,500 has been a significant line of resistance for the Dow Jones, over 2000 points below the Dow Jones’ last all-time high.
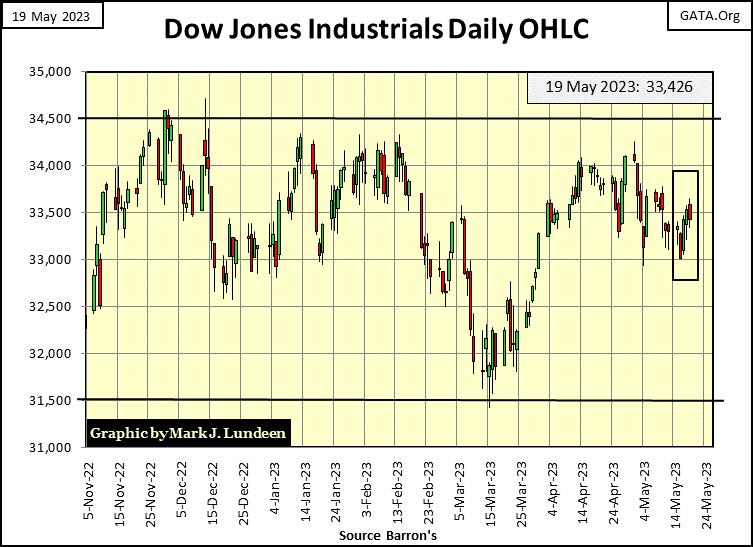
This is a tedious market; a market that won’t go down, and can’t go up. The public will eventually grow weary of things as they now are on Wall Street. But what are investors supposed to do? Take their money out of the market and deposit it in a bank? Not much of a choice. Maybe the thing to do is exit the stock market at current levels, and buy gold and silver bullion, assets with zero counter-party risk, and then shares in some gold and silver miners too.
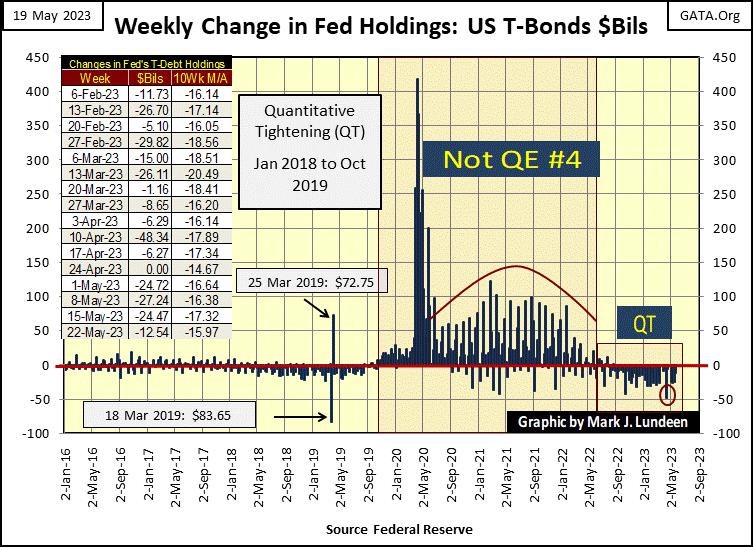
The idiots at the FOMC are continuing their QT, which they began a year ago. The last time they “injected liquidity” into the financial system was last August, when they “injected” a puny $1.6 billion into it.
I’m surprised the financial system hasn’t crashed since last May for all we see in the QT below. Along with rising interest rates and bond yields, it’s amazing the “policy makers” have kept the public in the financial system, holding on as they wait for the bull-market festivities and easy money to begin once again.
I haven’t covered open interest for gold in a while, so let’s do so now. I’m not in anyway an expert in trading futures or options in gold, or anything else. But I don’t have to be to learn something from studying a long-term chart, as seen below, beginning at the January 2001 start of the bull market in gold. Open interest in blue / left scale, the daily price of gold in red / right scale.
The bull market began in early 2001, as the price of gold closed just above $250 an ounce, with open interest around 150,000 contracts. This was the bottom of a two-decade long bear market that began in January 1980.
One could purchase gold for $250 an ounce in 2001, because at the bottom of this, or any other bear market, there was minimum demand for what is being traded, in this case gold. In early 2001, had you purchased a hundred ounces of gold at $255 an ounce, people would have laughed at you, as everyone wanted to own high-tech stocks then trading at the NASDAQ. It’s no surprise seeing gold’s open interest (the number of open contracts trading in the market) plunging below 100,000 contracts in the first half of 2001, for lack of demand for gold at the bottom of a bear market in gold.
Things were to change as momentum began increasing in gold’s bull market, as seen by the rising numbers for the price of gold, and gold’s growing open interest at the COMEX market. Both peaked in early 2008, as the sub-prime mortgage crisis began taking hold of the financial system. During this credit crisis, the price of gold would deflate by 30% by October of that year, as its open interest collapsed by 50%. That done, the price of gold and its open interest began their next phase of expansion.
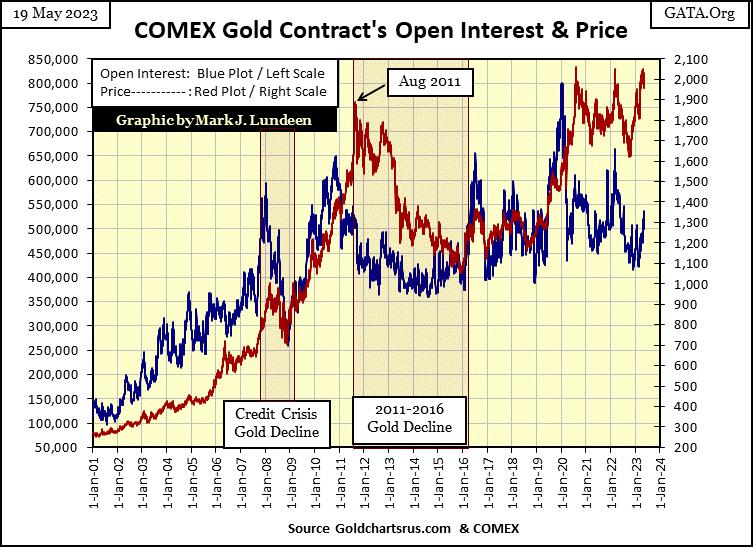
From October 2008, both gold and its COMEX open interest continued increasing, until open interest peaked in November 2010, and began declining a full nine months before the price of gold finally peaked in August 2011. A four-year, mini-bear market for gold, followed gold’s August 2011 peak.
In late 2015, Goldman Sachs predicted the price of gold would plunge deep below $1000 an ounce. It didn’t. But market sentiment for gold in December 2015 was bleak. How bleak?
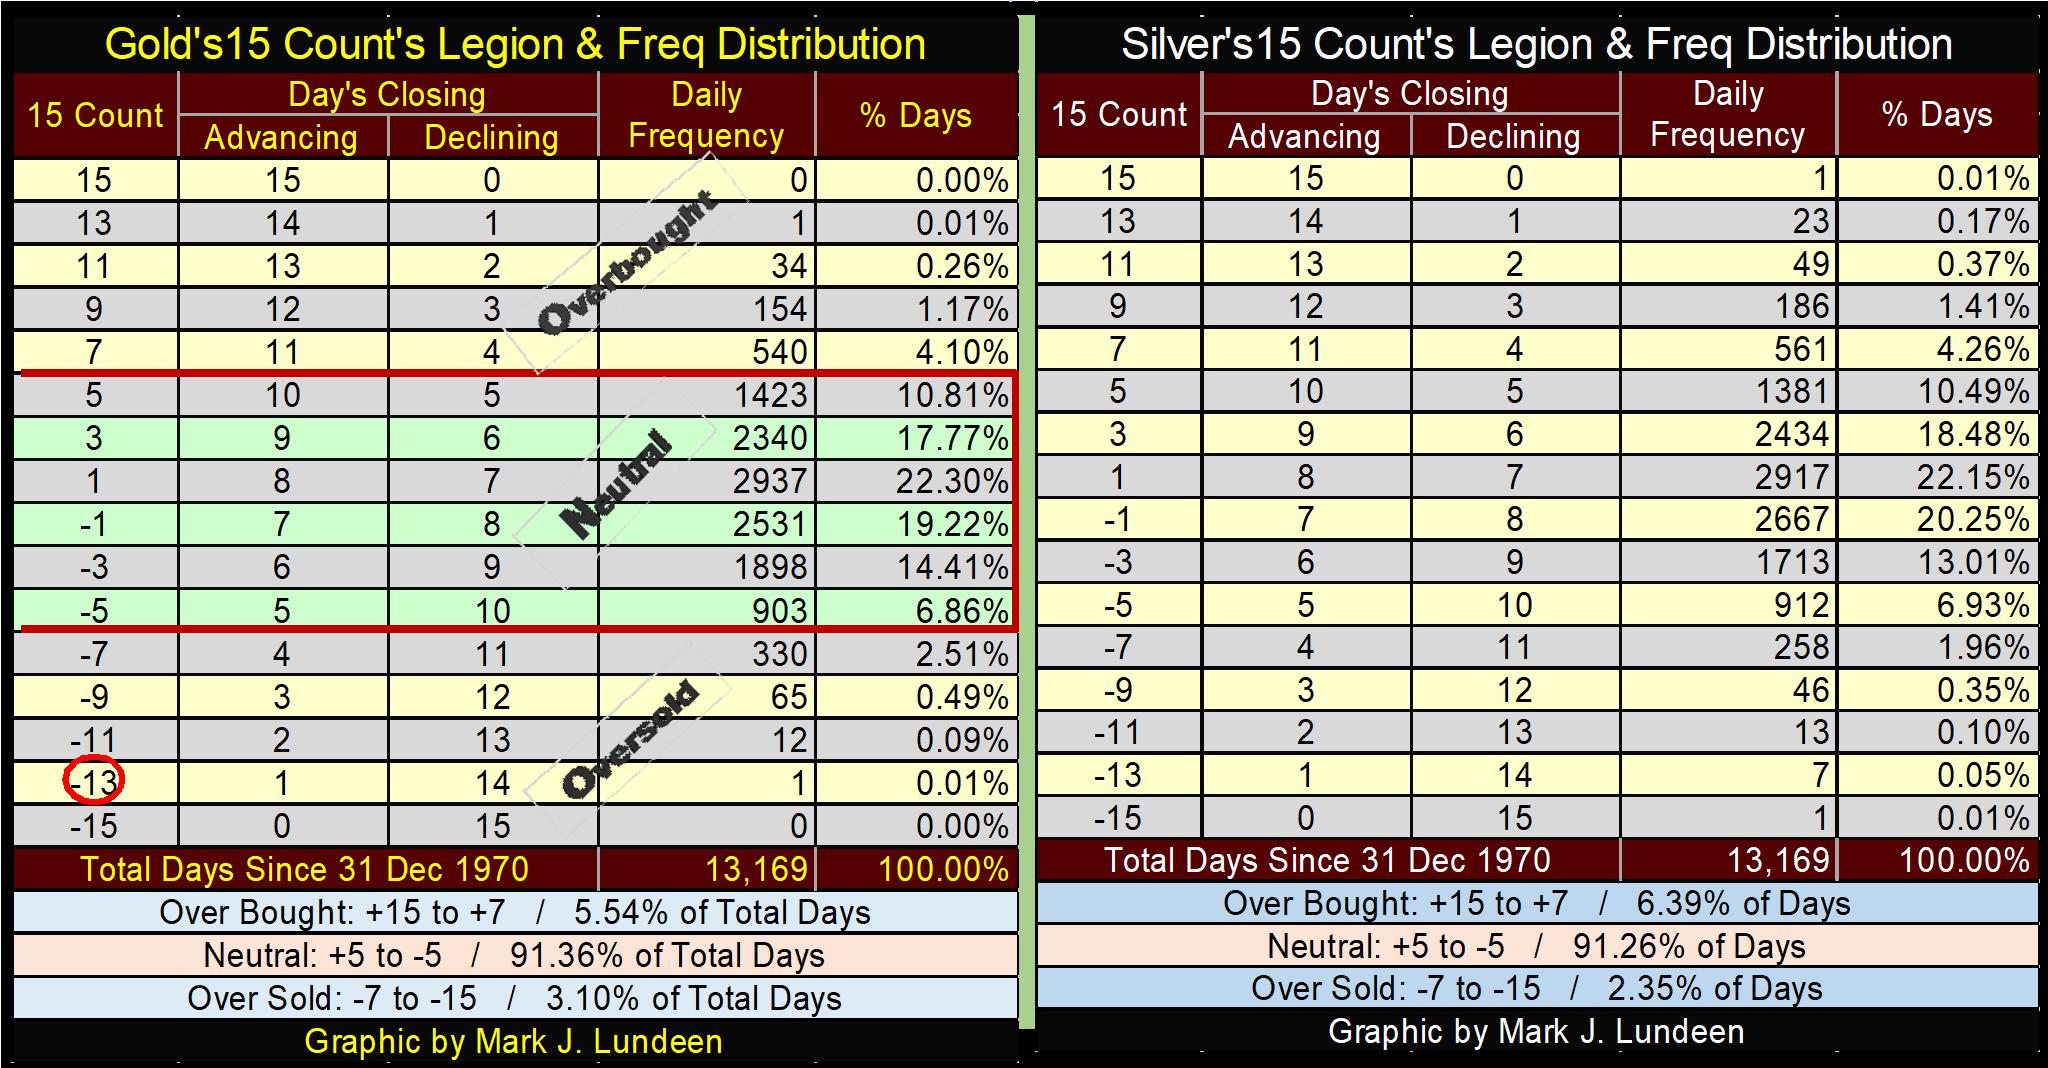
Below I have tables for gold and silver’s 15-count with their daily frequency distribution. The data goes back to December 1970, over fifty-two years of data, which includes the precious metals’ 1980 to 2001 bear market. Gold’s most oversold 15-count was a -13, or in a fifteen-day sample; gold closed down fourteen days, up only once. Silver’s was a -15, or fifteen consecutive daily declines. Both these extremes in gold and silver happened only once since 1970, in November 2015, at the bottom of the 2011 to 2016 mini-bear market seen above.
Returning to gold’s open interest and price chart above, following their 2015 lows, both gold and COMEX open interest began trending upwards for the next few years. In 2019 they broke out, with gold finally making a new all-time high in August 2020, an all-time high that stands to this day. But note how gold’s open interest peaked in January 2020 at around 800,000 contracts, and has come down considerably since then.
This technical formation looks very similar to what happened during the buildup and then collapse during the 2011 to 2016 gold decline, with gold’s open interest peaking, and then collapsing nine months or so before a new-all time high in the price of gold.
But the big difference between 2011 to 2015, and our current 2020 to 2023 collapse in gold’s open interest can be seen in gold’s BEV chart below, where the price of gold collapsed by 45% in December 2015. With our present collapse in open interest, the price of gold has so far refused to plunge deep below its BEV -20% line. Instead. Gold has continued making attempts at new all-time highs for the past three years. From one plunge in open interest, to another in the gold market, that is quite a difference in the response from the price of gold.
Another way of looking at gold’s BEV chart below, in light of COMEX open interest reductions, is like this; why did gold suffer from a four-year, 45% bear market from 2011 to 2015? Because the COMEX goons could make that happen back then.
With a very similar open interest collapse in the gold market, why since August 2020 ,has gold seen only a 22% price decline, as it continues making attempts at a new all-time high? Because the COMEX goons can no longer prevent gold from doing that.
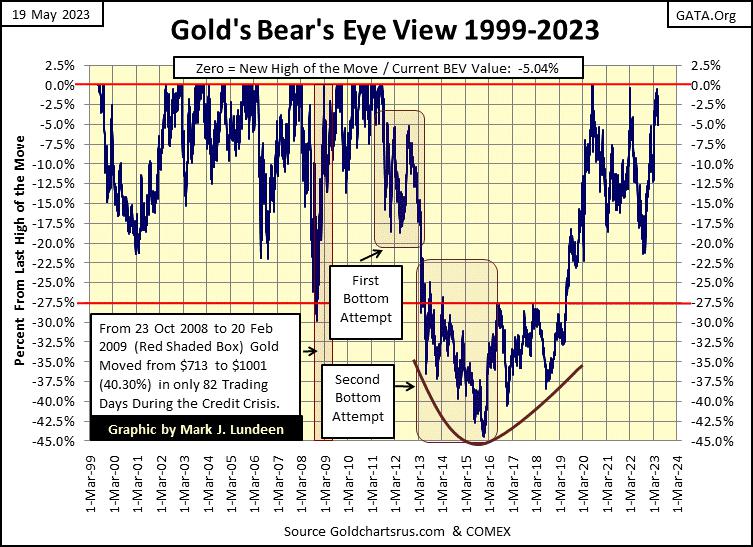
Looking at the above chart plotting the price of gold and its open interest once again, since open interest began collapsing in January 2020, I can see the possibility of the price of gold collapsing as it did during the four years of 2011 to 2015, as seen in the BEV chart above. But it’s been three years now, and so far, in no way has anything like that happened.
The financial system is now in the throes of another banking crisis. With market watchers anticipating which regional bank will next be taken over by the government’s “regulators,” I’m assuming the post August 2020 lows for the gold market are in. The goons may yet force gold back down below its BEV -10%, or even its -15% lines. Still, I expect the NEXT BIG THING in the gold market is another run into market history. Hopefully before Christmas.
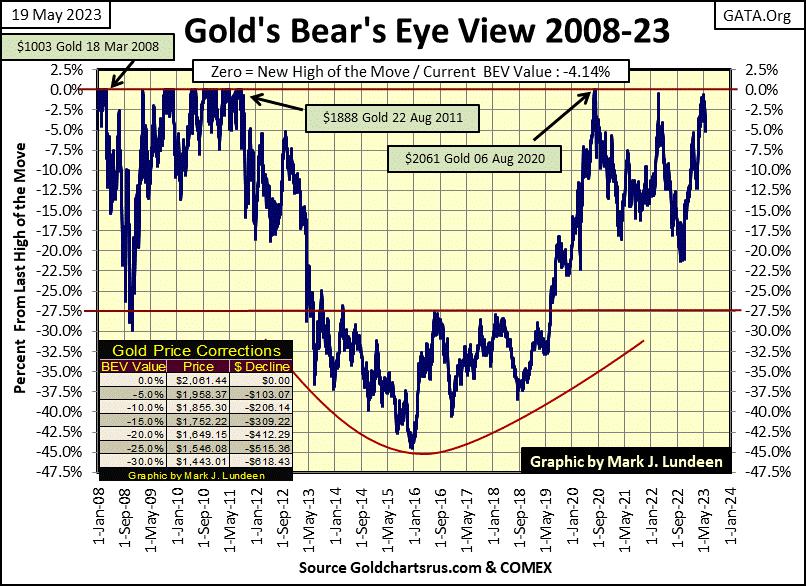
Here is this week’s BEV chart for gold, where I list the dollar values for the Terminal Zeros (TZ), the last all-time highs of a few market advances in the gold market. There was the daily close of $1003 on 18 March 2008, an all-time high on the BEV Zero line (0.0%). Three years later, gold closed at $1888 on 22 August 2011. An advance of $800 dollars, but just another big-fat Zero (0.0%) to Mr Bear. And our last TZ of $2061 of 06 August 2020, more than double from gold’s close of $1003 on March 2008, but just another BEV Zero on gold’s BEV chart below.
This is what a Bear’s Eye View (BEV) chart displays; new all-time highs (BEV Zeros / 0.0%) and percentage claw-backs from those BEV Zeros. And one can tell a lot about the market from Mr Bear’s claw-backs, from one TZ to another. For instance, from the August 2011’s TZ, where Mr Bear claw-backed 45%, to the 22% claw back from the August 2020 TZ, where we are learning the gold bears are growing weaker, as the gold bulls are growing stronger.
The bull market in gold has become more resilient to the ravages of the bears. And from that observation, good things in the gold market should be anticipated.
In gold’s step sum table below, gold’s 15-count saw a +7 on May 10th. That is an overbought 15-count, and markets don’t like being overbought, so we’re seeing a sell off from May 10th. In time, gold will recover from this sell off.
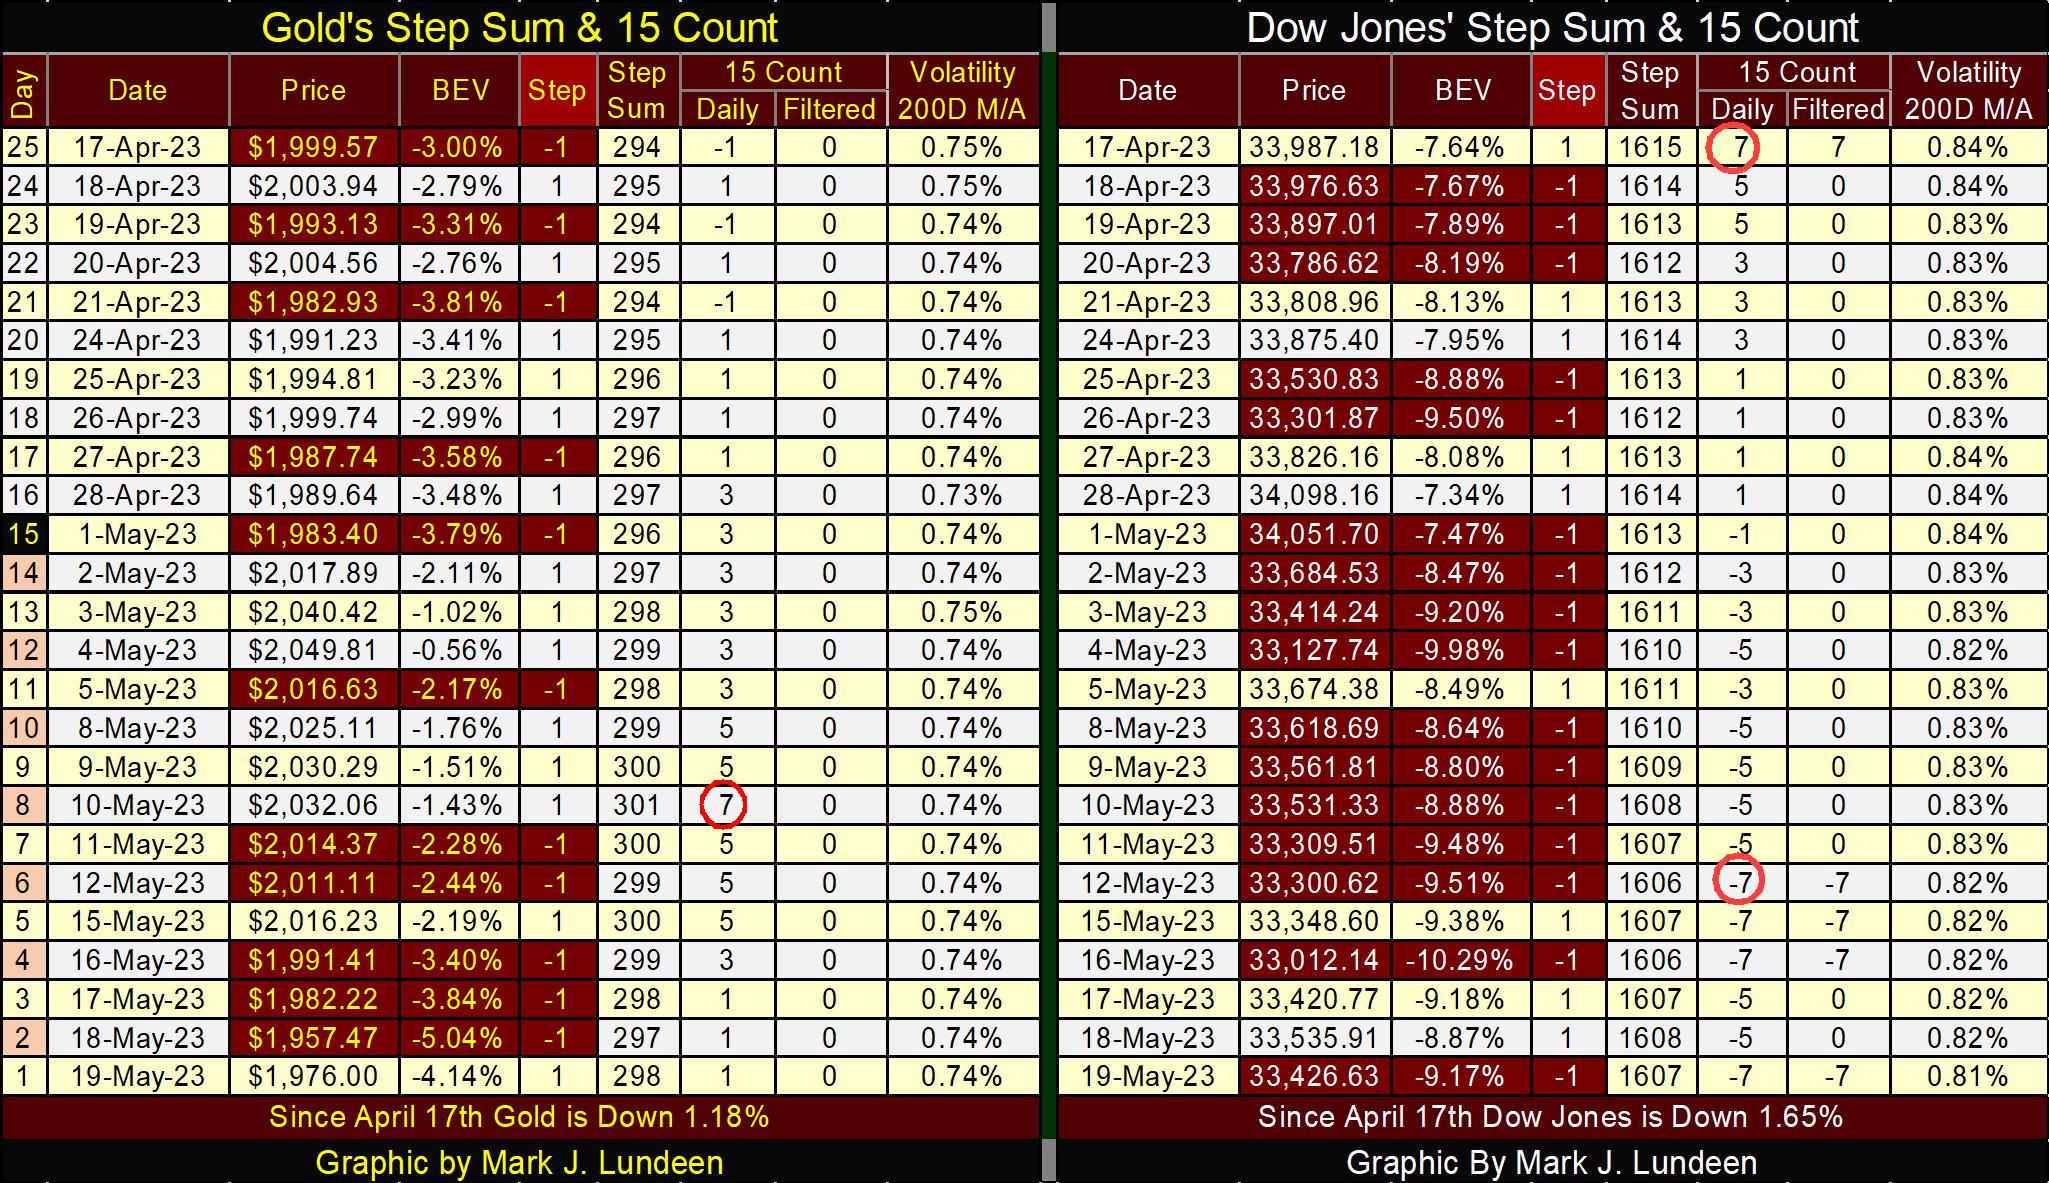
On the Dow Jones side of the table above, not seen are the three +9 15-counts the Dow Jones saw in mid-April. A 15-count of +9 is a very overbought market, and markets don’t like being very overbought, so it’s not surprising seeing all the daily declines in the Dow Jones table above, as it works off that very overbought condition. With a 15-count of -7 on May 12th, the Dow Jones is now oversold.
What is a bit odd, Dow Jones’ daily volatility’s 200D M/A has come down from 0.84% to 0.81% with all those down days. Bear markets see increasing daily volatility, but daily volatility is going the wrong way for a bear market. Also, bear markets see days of extreme market volatility, days the Dow Jones moves 2%, or more from a previous day’s closing price. So far in 2023, we’ve seen only two of those, with the last one on February 21st, three months ago.
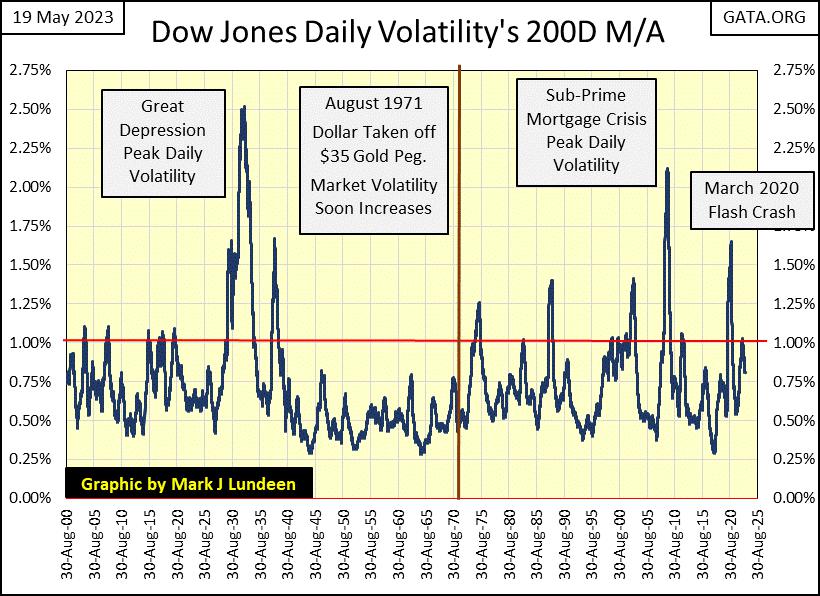
Should we get bullish on the stock market again? Nope, far from that. I expect the current market tedium will continue for as long as daily volatility for the Dow Jones remains in decline. How long will this decline seen in the chart above continue? I don’t know. But I do expect that when daily volatility seen above once again rises above its 1.00% line, the market will no longer be thought of as tedious.
Eskay Mining had a press release this week letting everyone know not only are they still alive and kicking, but will have a drilling program for 2023.
https://eskaymining.com/news/news-releases/eskay-minings-2023-exploration-program-focuses-on-5454/
This PR all good news, if not much that is new. I’m more than a bit disappointed at how low the share prices for Eskay Mining have fallen since their highs of 2022, highs which happened before the results of the 2022 drilling program were out.
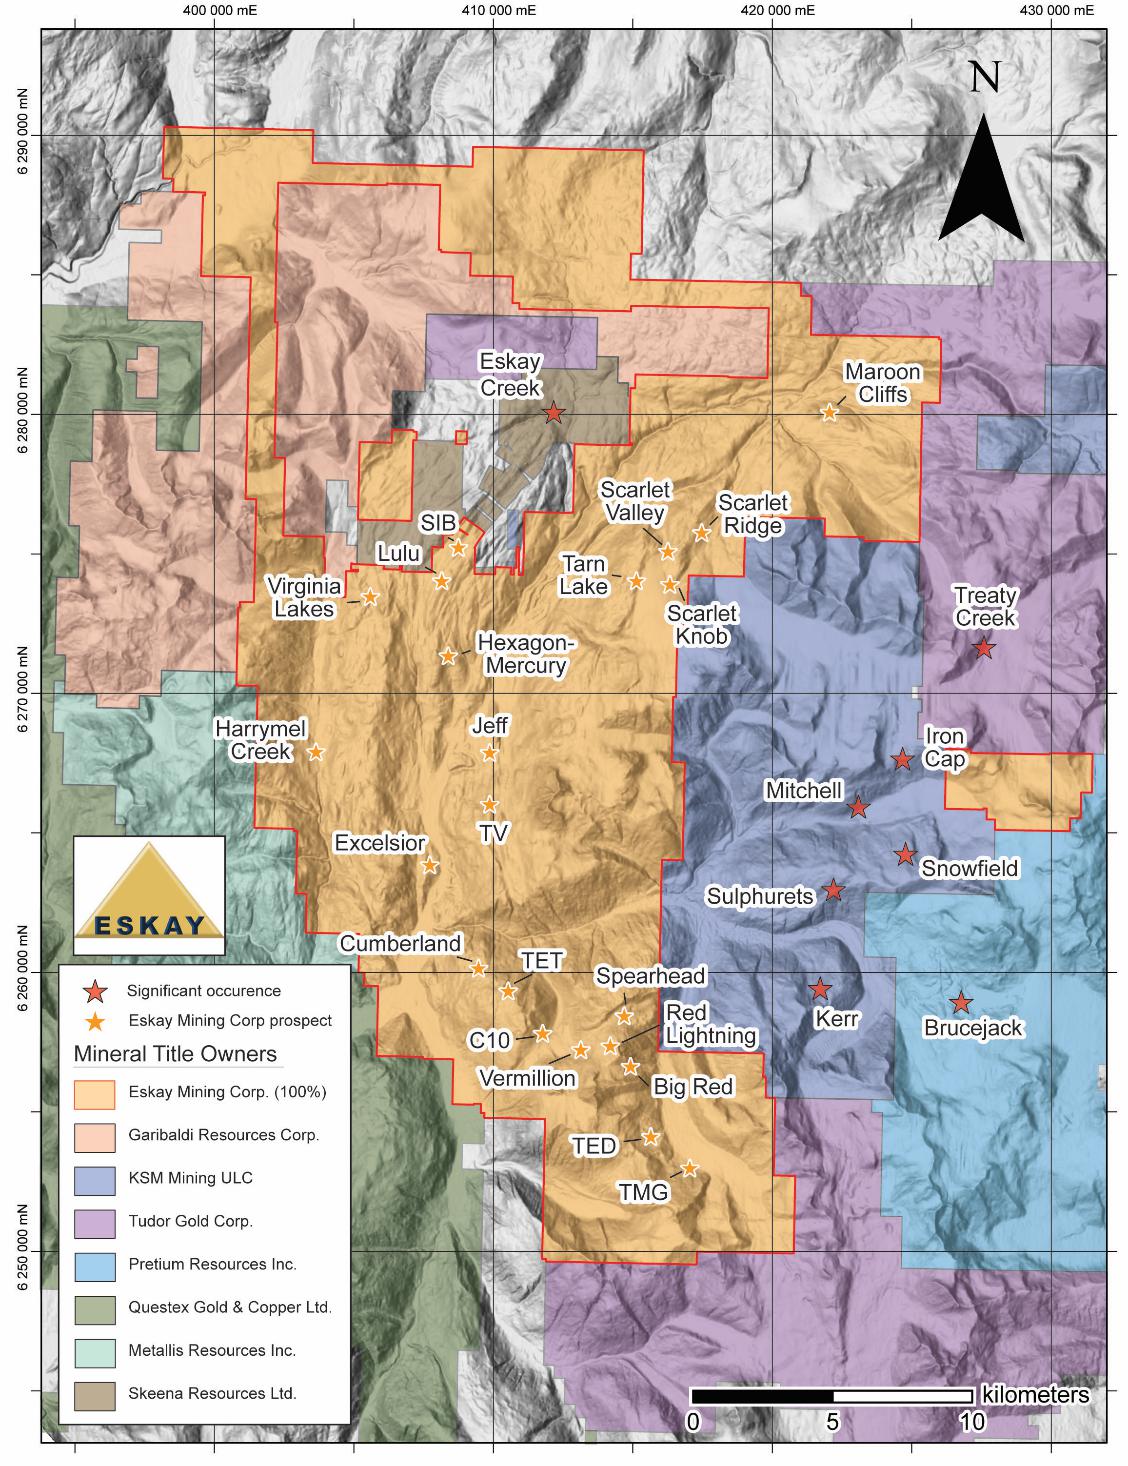
You may say that the market was underwhelmed by last year’s drilling program. But, last year Eskay Mining proved their property hosted huge VMS deposits, from which additional Eskay Creek Mine, high grade gold and silver deposits will hopefully be found. That was huge, as it was always guaranteed that such deposits existed near the old Eskay Creek Mine, but not necessarily to be found on Eskay Mining’s property, see map below.
That accomplished, I thought the share price of Eskay Mining would have increased as 2023 came around. But the market is the market, and investors can only sell, what others on the other side of the market are willing to pay.
There are no guarantees in this life, especially so when dealing with mineral exploration. Still, I’m anticipating as 2023 comes to an end, the market will be willing to pay much, much more for shares of Eskay Mining when its drilling program results are published.
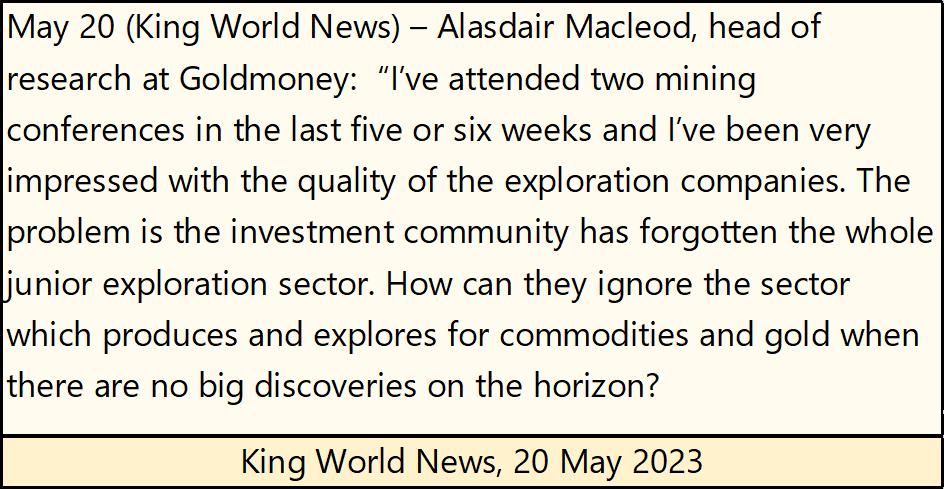
This week King World News (KWN) had an interview with Alasdair Macleod of Goldmoney. The first part of the interview was on the growing problems with the global banking system. The second part was on the gold miners, with some comments on the gold and silver exploration companies, such as Eskay Mining, though not mentioning Eskay Mining specifically.
https://kingworldnews.com/macleod-says-gold-silver-investors-are-in-for-one-hell-of-a-ride/
If you believe the way to make money in the market is by buying cheap when no one wants what you’re buying, and then selling dear when everyone wants what you have, well you first have to buy cheap. I believe the gold and silver miners are now cheap, that that is especially so for the exploration companies.
Every now and then I reflect on what I’m doing in the world. Whether or not I’m giving to society more than I’m taking, or at least if I’m making an effort to be a contributing member of the human race. One of the things I do is write a weekly market letter, such as the one above.
I’m not a “market expert”; I’m far from being one. But I have been a market enthusiast for many decades, and I’ve learned a few things on my personal journey in the markets. So, I like sharing with my readers what I’m thinking about, when it comes to the stock market or gold and silver, plus I have charts and tables not found anywhere else.
So, I’m a market guy, and I would really like to remain a market guy, except in good conscience, I can’t remain silent while villainous riffraff are in the process of murdering billions of people with their CCP covid virus.
It seems there are too many useless eaters consuming Earth’s precious resources, you know, people like you and me. So, Klaus Schwab; economist (of course he is) and founder of the World Economic Forum (WEF) has been planning to do something about this situation for decades. What kind of things? The covid virus pandemic is but one of them.
As it turned out, the covid virus, a bio-weapon funded by the US taxpayer, had a 99% survival rate. So, their real kill shot; was the so-called vaccine for the covid virus created by the big pharmaceutical companies. The covid vaccine isn’t really a vaccine, but a mRNA gene therapy that rewrites people’s DNA sequences, so any damage done to its victims, is also passed on to their children.
https://2020electioncenter.com/watch?id=6466aff8a9ffe2a55ab79582
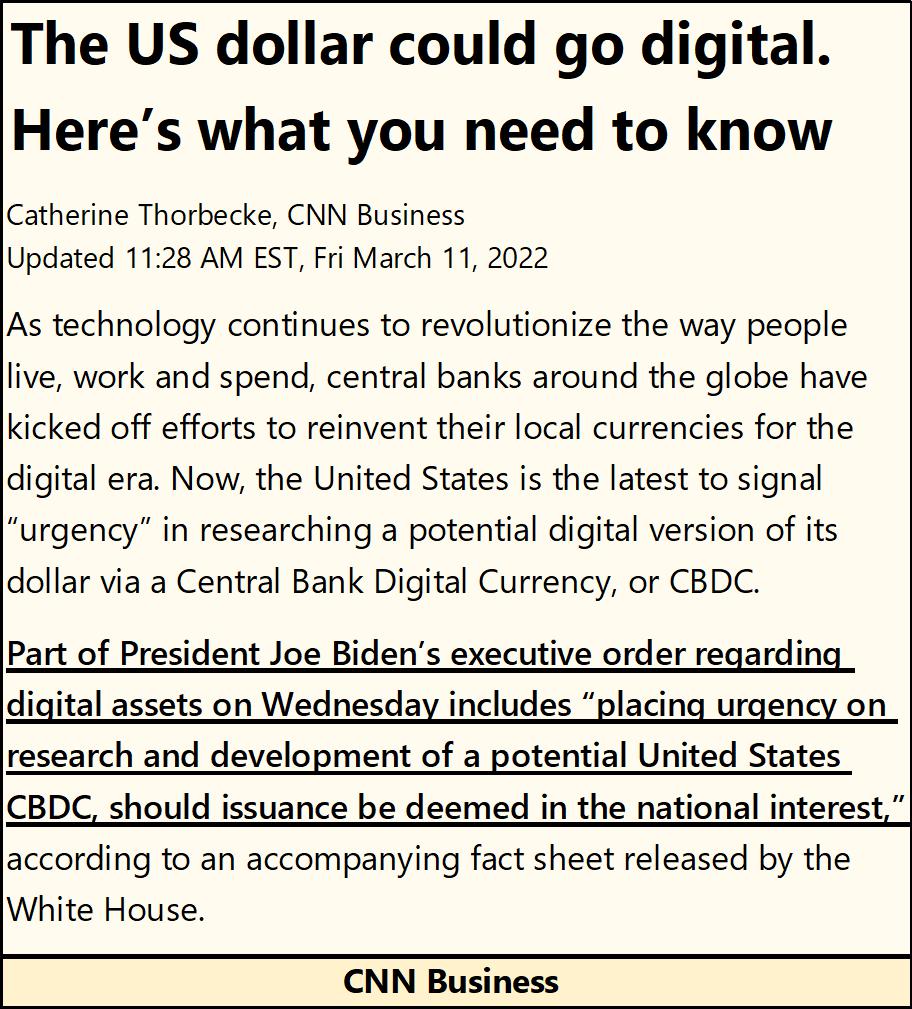
It’s not just the covid assault on Earth’s human population that’s upsetting me. After the Federal Reserve has totally trashed the US dollar over the past 100 years, they now intend to go with a digital-cyber currency that will give these evil people total control over the personal finance of the American people.
https://www.cnn.com/2022/03/11/tech/us-digital-dollar-cbdc/index.html
You may believe purchasing gold and silver bullion will provide safety for your personal wealth. But this is a problem the idiots at the FOMC have found a solution to; once they institute the Federal Reserve’s digital currency, they will make your gold and silver worthless, as you won’t be able to trade your old monetary metals, for their new digital cyber currency.
This is how things will go if the global central-banking cartel is successful in implementing their digital cyber currencies; it will be game over for personal freedom, as people won’t be able to do anything that requires their digital currencies, without their permission. Your cell-phone will become your mobile prison, when its digital currency app, supervised by Googles’ AI, shuts down your ability to buy this, that and the other thing you thought you needed.
You don’t like that? Maybe it’s time for Americans to write a letter to their congressperson, and both senators, and tell them what they think about the Federal Reserve and their proposed digital currency.
Mark J. Lundeen
********
More from Gold-Eagle


