Gold And Silver Forecast Update: Cycles Topped As Expected


 A little over two weeks ago I wrote gold and silver price forecasts explaining that cycles should soon top and then head lower into December. Coincidently gold topped October 15th at $1,191.70, the day the gold forecast was released, and silver prices recently topped at $16.37. The gold forecast was timely, but the silver target went two days beyond our estimated timeframe. Below are the links to both forecasts.
Gold Forecast: Time For A Top And Then Another Drop
Silver Price Forecast: Targets And How To Turn Them Into Wealth
In full disclosure, the biannual cycle tops in both gold and silver haven’t been confirmed but I've seen enough evidence to write this quick update. Below I will explain the different types of cycles, and we will then analyze the charts.
Here is a quick explanation of cycles for those that aren’t familiar with my work. There are three dominant cycles in the precious metal sector; cycles are measured from low to low. Cycles are commonly used to determine potential buying or selling opportunities. First is the common cycle; it lasts approximately 20-trading days give or take a few trading days. Next is the biannual cycle, this is best for intermediate term trading, and it lasts roughly 6-months. Lastly, is the prevailing major cycle, it arrives every 8-9 years, with the last cycle arriving in 2008, and it often corresponds with a US Presidential election.
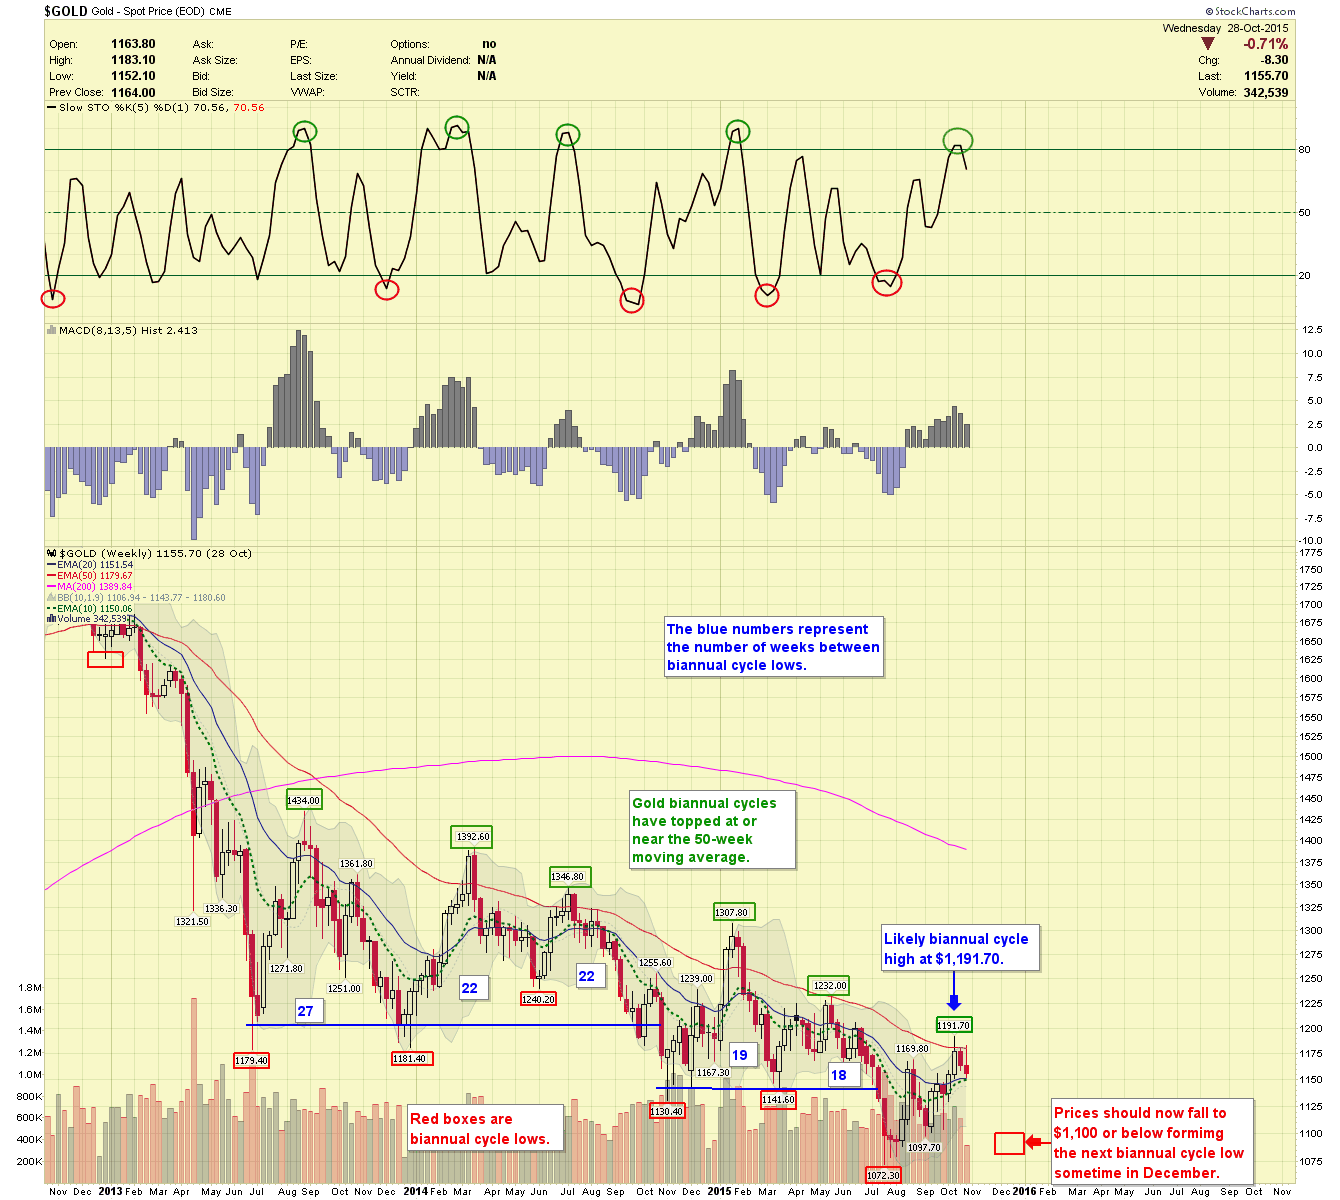
Now that cycles have been briefly described, we can look at some charts. For this, I often start with the weekly chart of gold. Here you will see prices form biannual cycle lows (red boxes) approximately every 5-6 months with the last arriving in mid-July. There has also been a pattern of cycles topping at or near their 50-week moving averages, currently @ $1,179.67. It appears the gold cycle topped October 15th as prices reached a high of $1,191.70. Gold prices should now head lower into a December low below the $1,100 level.
Weekly Gold Chart
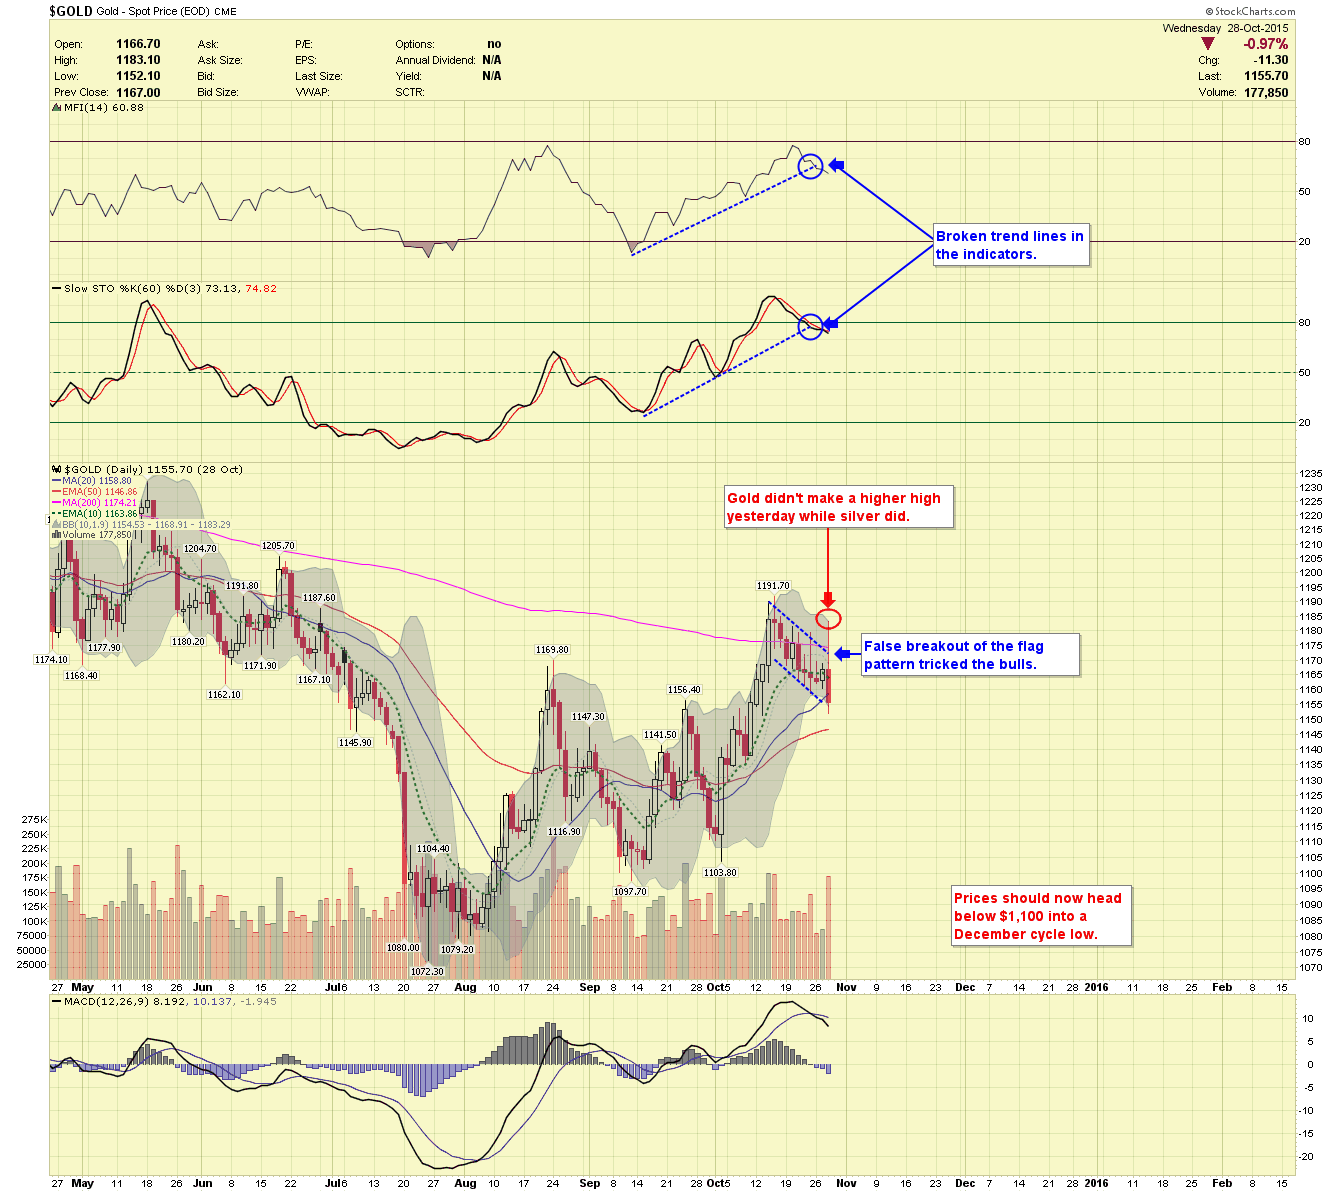
Daily Gold Chart
For the current view of gold, let us switch to the daily chart. Here you will see gold was making a flag pattern that ended in a false breakout yesterday; that move likely tricked some bulls. Prices were unable to make a new high with silver, and, therefore, formed a non-confirmation. At the top of the chart, you will see the trend lines have been broken in the indicators, also pointing to biannual cycle tops.
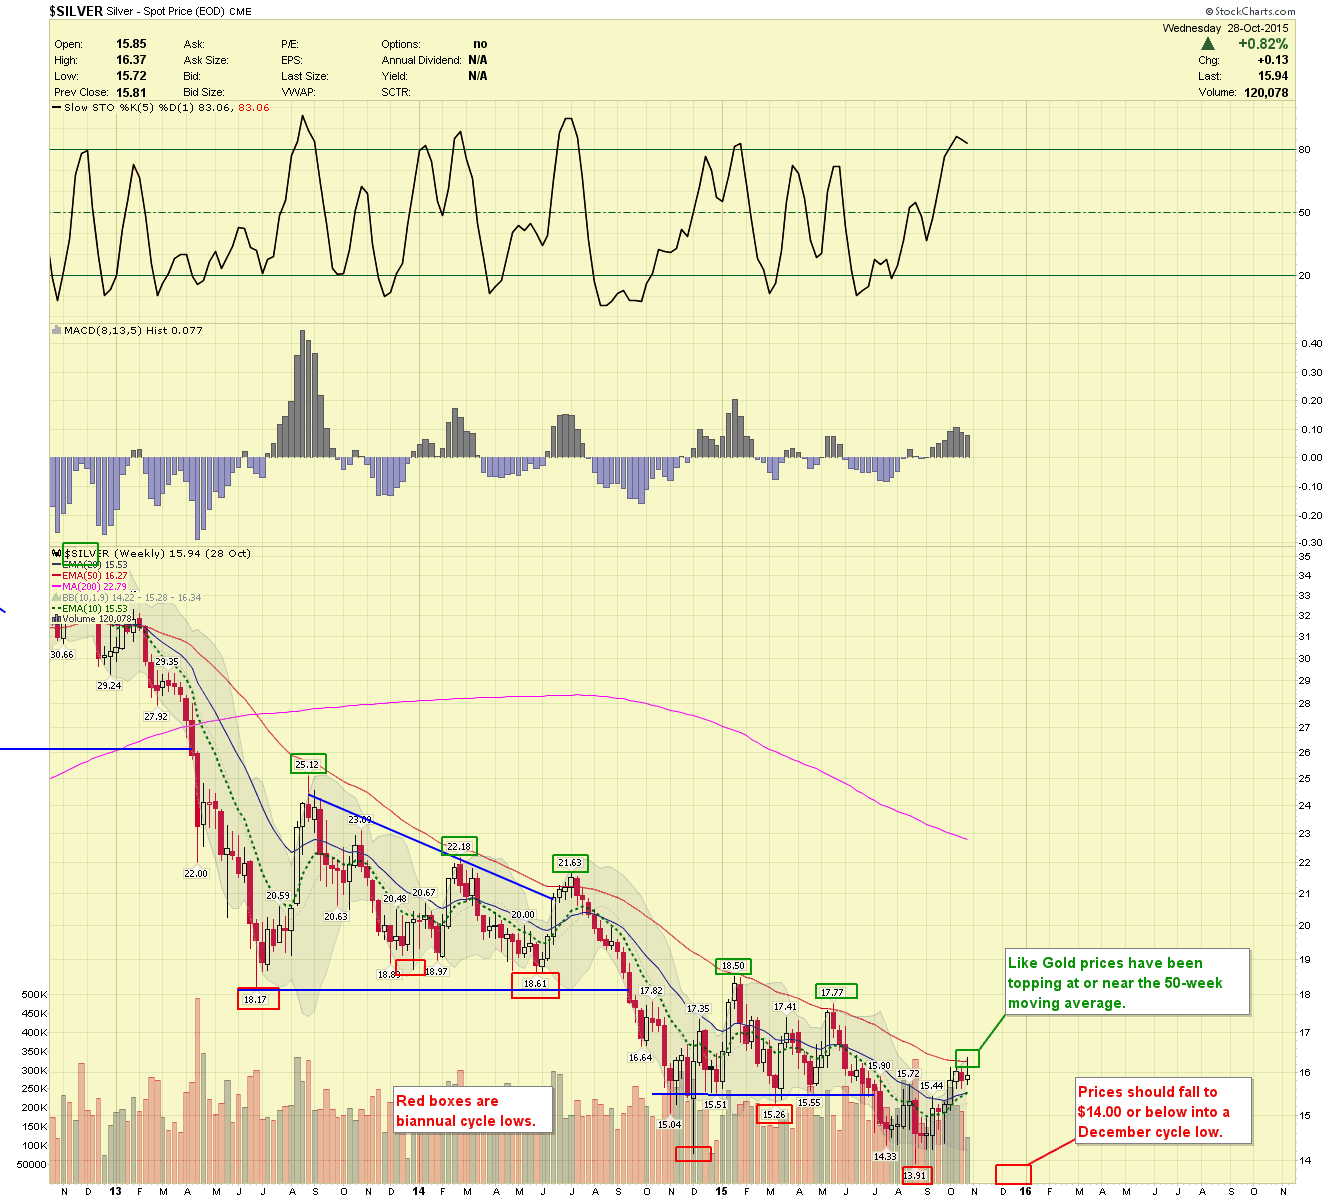
Switching to silver you will see prices top at or near their 50-week moving average, currently at $16.27. I thought our targets were going to fall a bit short, but prices shot up Wednesday fulfilling them. Now we should head lower into a December biannual cycle low. I expect them to challenge the $14.00 level and potentially even lower.
Silver Weekly Chart
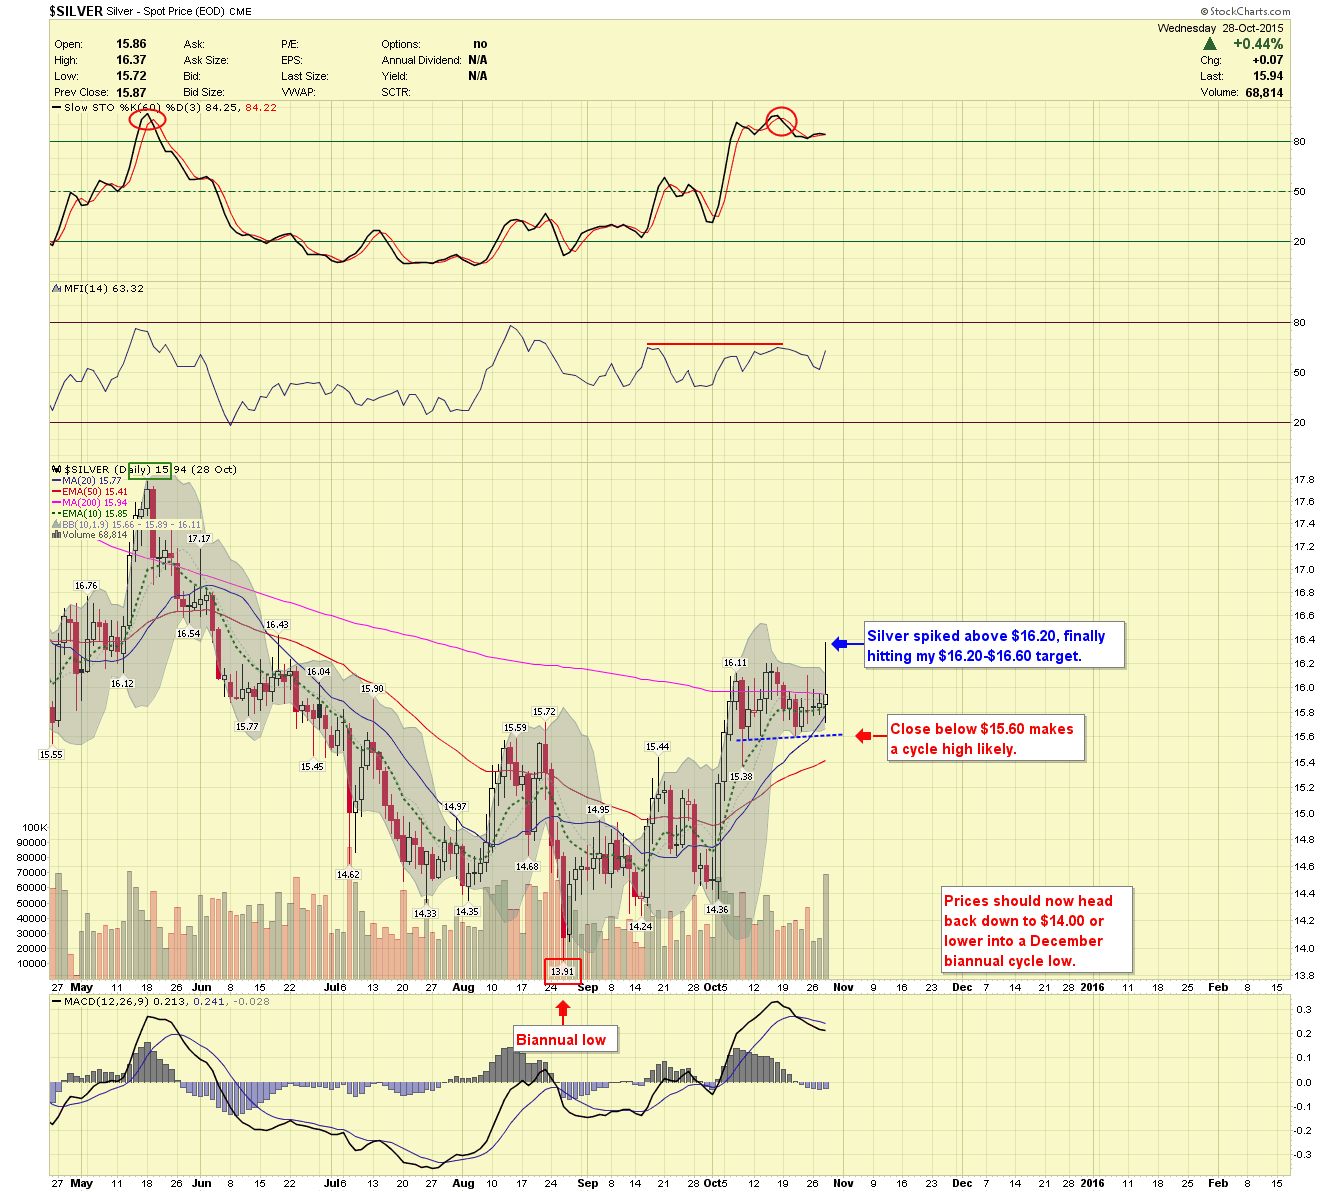
Silver Daily Chart
The daily chart of silver clearly shows the spike higher to $16.37, a close below $15.60 will confirm the likely top. Prices should head lower and as the structure develops I should be able to narrow a tighter target area.
Visit us at http://www.buygoldprice.com/ for more information about cycles and to view our different services.


