Gold And Silver Prices Are Setting Up For Big Moves Higher


After six long years, the precious metals are finally setting up for BIG MOVES higher. Even though the gold price has increased significantly over the past two months, we haven’t seen anything yet. Of course, gold has already enjoyed big moves in other currencies such as the British Pound where it has reached an all-time new high.
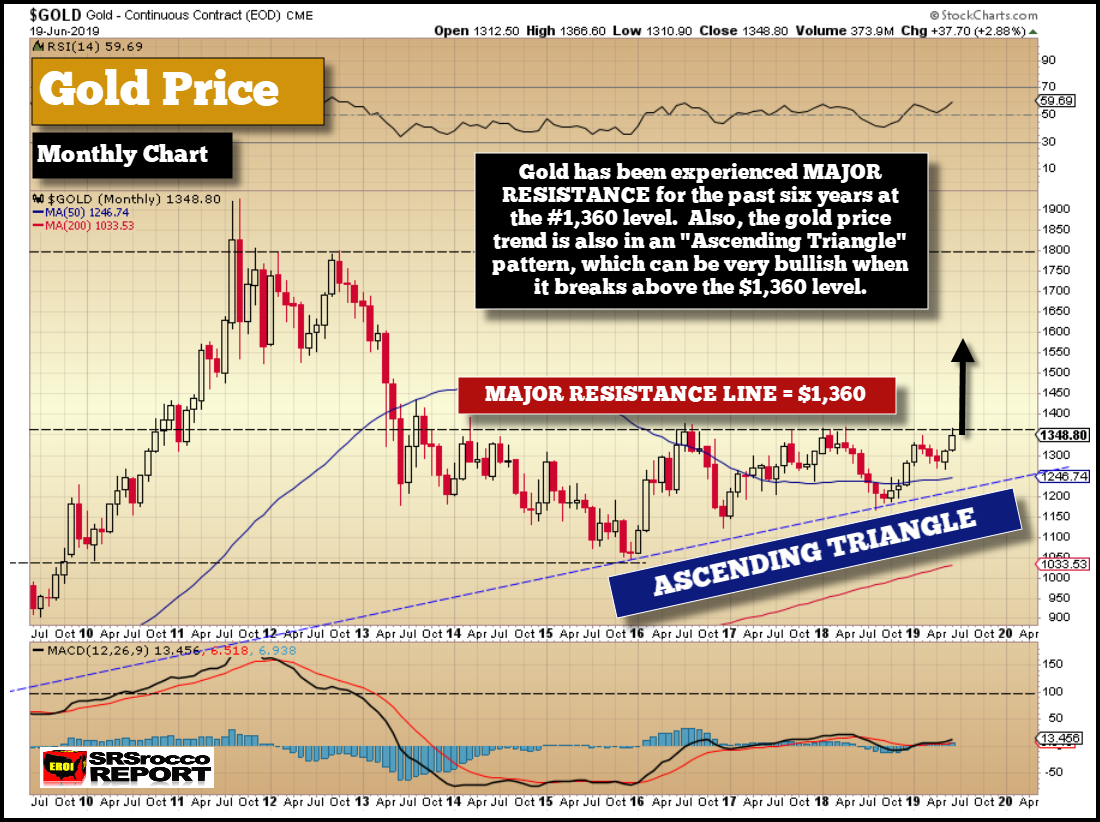
However, we have to be a bit more patient for gold to reach a new high in the U.S. Dollar as the Federal Reserve has a monopoly on the world’s printing press. But, it is important to understand that gold has broken through a KEY LEVEL and is giving the green light to the market that a new bull market has begun.
I wrote about gold breaking out of this key level back on June 20th, in my article, FINALLY… GOLD BREAKS OUT THROUGH KEY 5-YEAR RESISTANCE LEVEL. In that article, I posted this chart on gold:
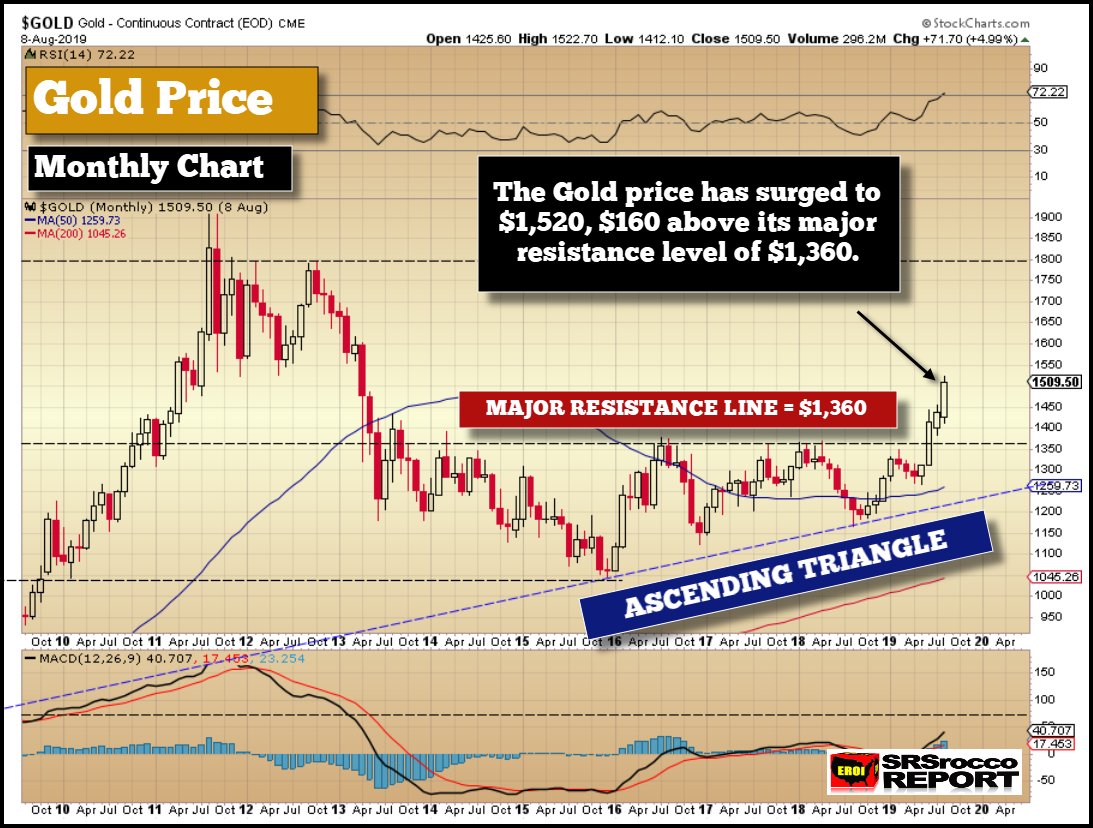
As of trading yesterday, the gold price closed at $1,509, but reached a high of $1,520. Thus, the gold price surged by $160 once it broke above that crucial 5-year resistance level:
However, as I stated, this is just the beginning stage for much higher gold prices moving forward. Why? Well, the Fed and Central banks haven’t solved any problems since the 2008 financial crisis. Rather, the central bankers have papered over the problem with money printing and a zero-interest-rate policy. According to a few sources, there are $14 trillion in negative-yielding bonds in the world. Thus, bondholders are paying the central banks to borrow money from them.
Economists and analysts suggest that negative interest rates are a sign that the financial market has entered into unchartered territory. Unfortunately, they don’t understand the TRUE underlying reason for negative interest rates. While some economists have stated that negative interest rates are the central bank’s policy to force investors to put their funds into the economy, the real problem is that global debt is too high and the net energy profit in the system is falling.
I will get into this in more detail in upcoming articles and videos, but put simply, if the NET ENERGY that drives the economy is falling, then the interest rates must fall as well. So, get used to even lower interest rates and even more money printing by the Fed and Central banks. And, as the central banks continue with even lower interest rates and money printing, it means that BIG MOVES in the precious metals are coming.
IMPORTANT: While the precious metals have broken through key levels and will reach new highs in the future, we must understand that CORRECTIONS will take place. We should not be surprised if gold and silver experience significant corrections before moving into the next stage.
Now, while the gold price has enjoyed a MAJOR BREAKOUT, we are still waiting for silver to make its move. Yes, the silver price has broken above an important symmetrical triangle formation that I wrote about several weeks ago, but it must close significantly higher above its 200 Month Moving Average (MMA) of $16.82 to be in the first stage of a new BULL MARKET:
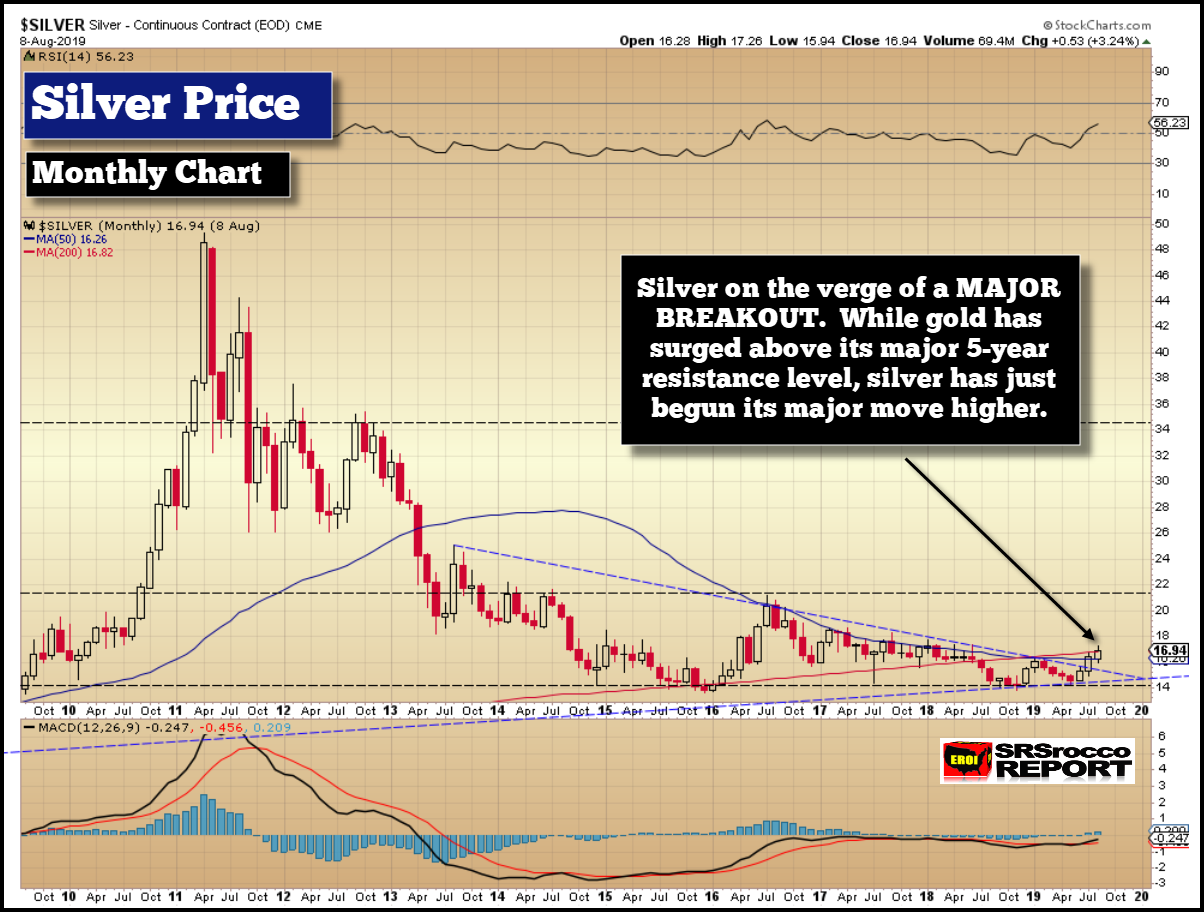
So, why is this 200 MMA (Red Line) such a critical level? Well, it was the next important level to take out after silver broke through the 50 MMA (Blue Line). I will be doing a new YouTube video on the precious metals this weekend, so please subscribe to my channel to receive updates.
As I have stated several times, while the FUNDAMENTALS are the underlying price drivers, the KEY TECHNICAL LEVELS provide the big punch as Traders, Investors, Hedge Funds, and Institutions all jump aboard. We can clearly see this taking place as silver approached the important 200 MMA. Please look at the following intraday silver price charts:
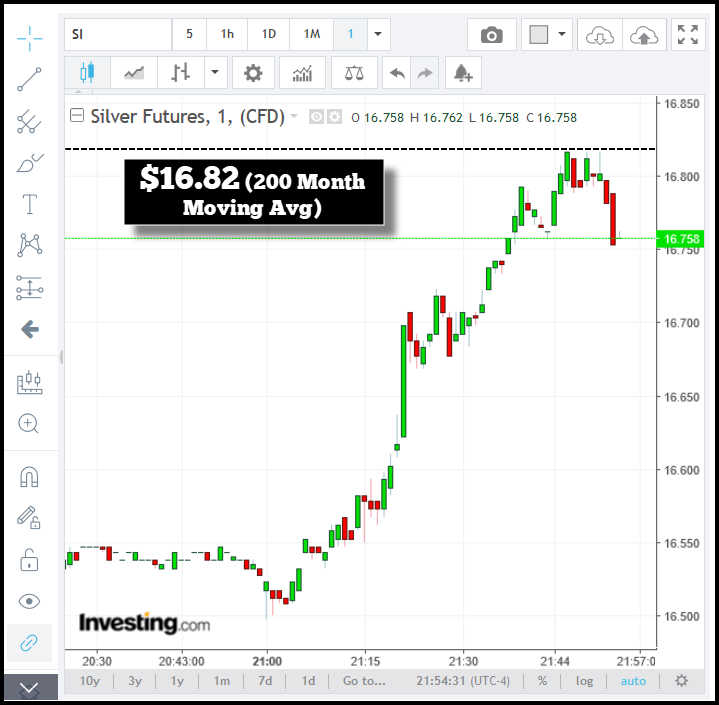
When the silver price first approached that key $16.82 level during Asian trading Tuesday night, it touched it several times and bounced off of it and corrected lower. Then in the next chart, we can see that as the silver price finally broke above that $16.82, it enjoyed a MINI-BREAKOUT to $17.00, and then eventually to $17.20:
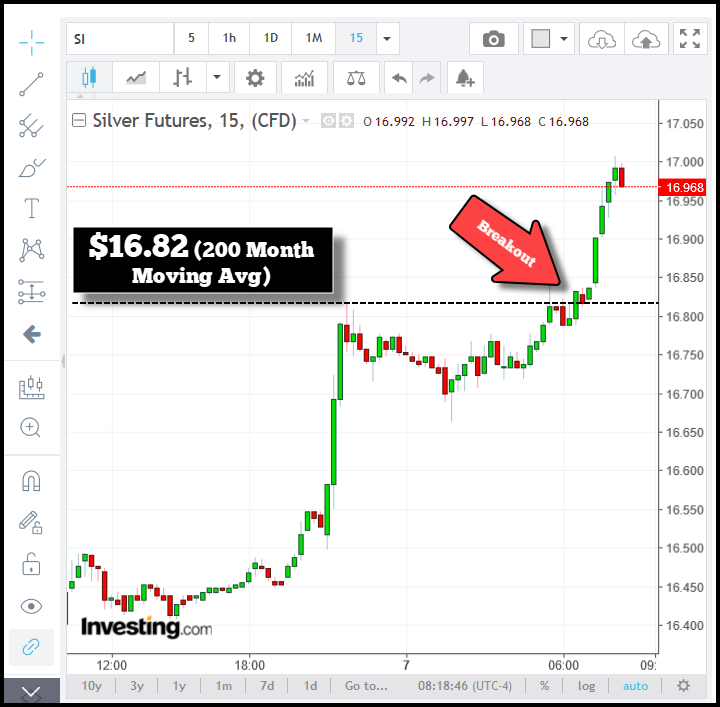
Once silver broke above the $16.82 level (200 MMA), we see that it corrected right back down to the same level during trading yesterday (Thursday):
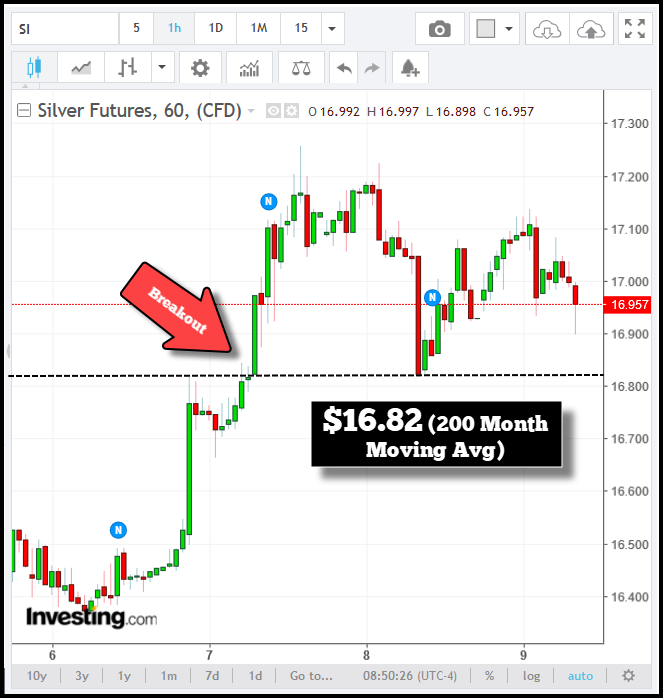
Now, I am going to repeat myself. THERE IS NO COINCIDENCE that silver traded off this important 200 MMA of $16.82. So, these KEY LEVELS mean something to traders and the charts are showing it right in front of our eyes, whether you believe in technical analysis or not.
Thus, when silver broke above that 200 MMA, it quickly shot up to $17.20 as it came on the radar of TRADERS, INVESTORS, HEDGE FUNDS, and INSTITUTIONS. These key levels act as a magnifying glass for the market. When they are broken, we see a HUGE increase in trading volume and investor interest.
*********

Independent researcher Steve St. Angelo (SRSrocco) started to invest in precious metals in 2002. Later on in 2008, he began researching areas of the gold and silver market that, curiously, the majority of the precious metal analyst community have left unexplored. These areas include how energy and the falling EROI – Energy Returned On Invested – stand to impact the mining industry, precious metals, paper assets, and the overall economy. He has written scholarly articles in some of the top precious metals and financial websites. Visit his website SRSrocco Report.


