Gold And Silver Ready To Go BOOM


 The wait for the next leg up in both gold and silver has been excruciating. Many bulls are losing hope and the number of bears appears to be increasing. As for me, I remain rock solid. I hold long silver positions and I must say I am not worried one iota. Of course I could be wrong. I seriously doubt it though. Let’s see why.
There are really only a couple of things I wanted to show in this analysis. We will use the weekly chart for gold and the daily chart for silver. Let’s begin with gold.
GOLD WEEKLY CHART
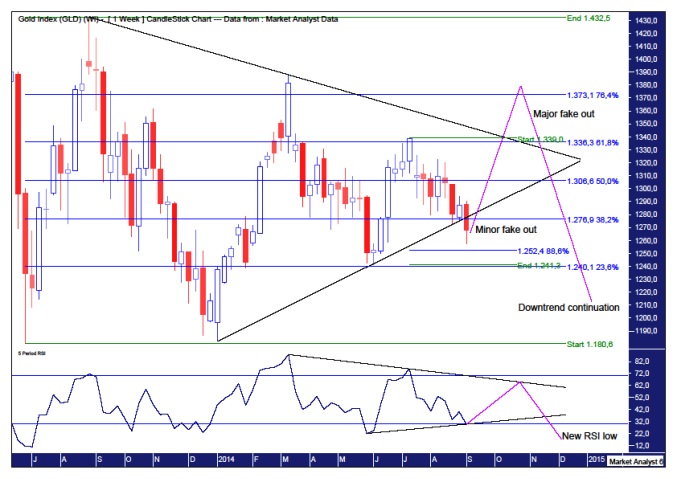
We can see the triangle formation as made by the two black trend lines I have drawn. This structure is on the charts of most, if not all, technical analysts. And so it should be. But it is very obvious. And when something becomes too obvious, I put on my contrarian hat.
From previous analysis, readers will be well aware that I am looking for a rally that busts the upper trend line in a fake out move. I expect the break to only be temporary before it reverses back down to continue the down trend.
Also, in previous analysis, I stated I thought the lower trend line would hold this current pullback. Last week it broke through and in doing so provided further clarity. That is, I believe this is the start of a double fake out. This current break of the lower trend line is the minor fake out while the bust of the upper trend line will be the major fake out.
So, we have currently in progress the first fake out or false break of the lower trend line. To confirm this, we will need to see price reverse back up. However, there may be a touch lower to go to put in the pullback low.
I have added Fibonacci retracement levels of the recent upleg from the June low to July high. This has already been a deep retracement and the next support level is the 88.6% level which stands at US$1252. Perhaps we will see a move down to there early next week before the belated reversal higher begins.
I have added a Relative Strength Indicator (RSI) which also shows a similar triangle formation. I expect the next high in the gold price to be accompanied by a RSI reading that stays within the confines of this triangle pattern. At the very least, comes in lower than the previous high reading as shown at the July top.
As for the eventual top of the rally (after it finally commences of course!), I am still zeroing in on the 76.4% Fibonacci level which stands at US$1373. It may even get up close to the March 2014 high of US$1387 but I doubt it will surpass it. A top up there would also create a double top with the trend. That would be very bearish and would certainly suit my bearish outlook of gold then heading to sub US$1000 for the final low.
For those that still doubt we are about to see a major rally, let’s just focus on the pattern of trading here. Note how from the June low, it took 6 weeks or 6 candles, including the low and high candles, to reach the July high. Since then, price has only retraced just over three quarters of that move but it has already taken 8 weeks and a new low next week will make it 9 weeks. This means price is showing more impulsiveness when it goes up than when it goes down. That generally means the trend is up. Keep in mind this is a bull trend within an overall bear trend.
Let’s now look at silver.
SILVER DAILY CHART
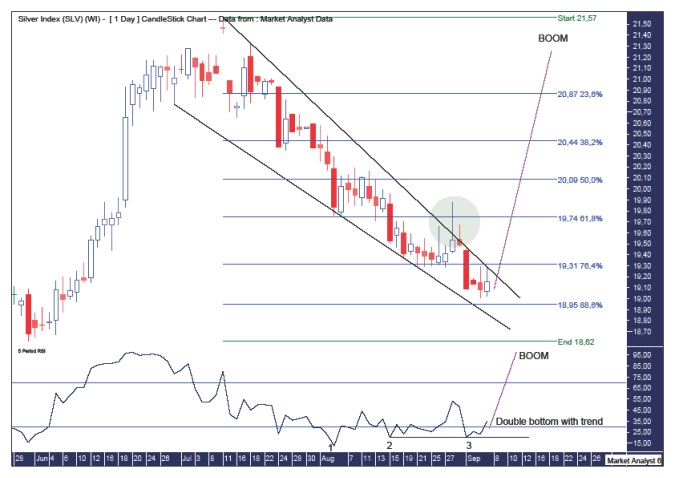
I have drawn two black down trending lines. We can see price recently had a fake out to the upside before continuing downwards. This can be seen in the green highlighted circle. Price is now hovering just above the 88.6% Fibonacci level. I suspect price can dip down just below there early next week, perhaps down close to the lower trend line, before reversing higher.
The most interesting feature of this chart revolves around the RSI and, I must say, it has me captivated. That is the double bottom with the trend. This is essentially a triple bullish divergence as denoted by the numbers 1, 2 and 3. However, the last two lows have shown virtually identical RSI readings. This double bottom pattern generally leads to a powerful move higher.
Now keep in mind we are talking about the RSI and not price. What is interesting about the last few days trading is that price went marginally lower while the RSI did not. Price may still go lower yet without breaking the RSI double bottom.
In fact, in my opinion, early next week will see price trade lower on an intraday basis before staging a massive reversal higher. Price will go boom and so too will the RSI.
As far as I’m concerned, it’s just a matter of time now. Tick-Tock.
********
Please register your interest in my website coming soon. Any questions or suggestions, please contact [email protected]
© 2014 Copyright Austin Galt - All Rights Reserved
Disclaimer: The above is a matter of opinion provided for general information purposes only and is not intended as investment advice. Information and analysis above are derived from sources and utilising methods believed to be reliable, but we cannot accept responsibility for any losses you may incur as a result of this analysis. Individuals should consult with their personal financial advisors.


