Gold And Silver Thrive In High-Debt Environments


Struggling to contain the economic fallout from the pandemic, central bankers have realized that keeping interest rates low and maintaining hundreds of billions in monthly asset purchases (ie. quantitative easing), have not given the desired economic boost; now they are counting on fiscal policy, ie., government spending, to do the trick.
However, the US government does not have the money, so they borrow (print) it, at current rock-bottom interest rates.
A $3 trillion budget deficit is predicted for 2021, nearly as high as 2020’s $3.1 trillion, and more than double 2019’s $984 billion. The US government under President Trump spent $4.5 trillion on pandemic-related relief, helping to boost the national debt to $28 trillion. This was followed in 2021 with President Biden’s $1.9 trillion covid-19 relief package, dubbed the American Rescue Plan, which passed Congress and has his signature.
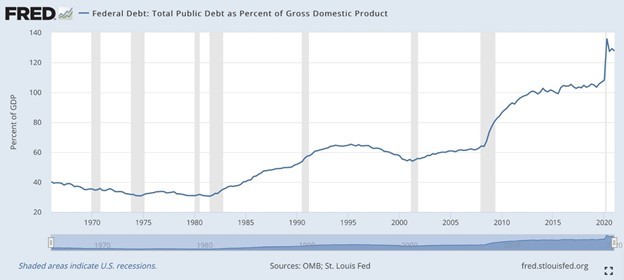
The debt-to-GDP ratio is an important metric economists use for comparing a country’s total debt to its gross domestic product (GDP).
The percentage, arrived at by dividing the country’s total GDP by its total debt, indicates the country’s ability to pay back its loans. The higher the percentage, the higher the risk of a country being unable to pay the interest on its debt, and therefore defaulting on its debt. (countries with high debt-to-GDP ratios typically have trouble paying off debts. Because they are a higher risk to paying loans back, creditors demand higher interest rates. If a country’s debt-to-GDP ratio becomes too extravagant, creditors may stop lending to it altogether)
In October 2020, US debt zoomed past 100% of GDP for the first time since World War II. That means the amount owed is greater than the size of the entire economy.
According to usdebtclock.org, the current national debt sits at $28.6 trillion, and it is increasing with each tick of the clock.
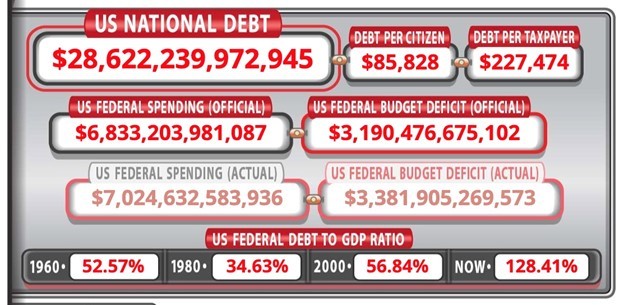
Source: usdebtclock.org
More spending is on the way. A LOT MORE. As Rahm Emanuel said during the Great Recession, “You never let a serious crisis go to waste. And what I mean by that it’s an opportunity to do things you think you could not do before.”
Biden and his Democratic majorities in Congress appear to be taking this advice and running with it.
The next round of spending involves Biden’s $1 trillion infrastructure bill, just passed by the Senate but not yet approved by the House; and a $3.5 trillion anti-poverty and climate plan Senate Democrats hope to get passed this fall. The latter includes universal daycare, two free years of community college and expanded Medicare.
The Wall Street Journal reports that action on the $3.5T spending package, which at this point is just an outline, will come after the Senate wraps up the bipartisan infrastructure bill. Senate Democrats are expected to use reconciliation to approve the bill’s outline, a budgetary procedure whereby Democrats are able to advance legislation with a lower level of Republican support in the Senate (the Dems have a simple Senate majority with their 50 votes plus Vice President Kamala Harris’s vote). We predicted this would happen back in January.
As mentioned at the top, the government doesn’t have the money for this extravagant level of spending so they will borrow it. The Journal notes that Democrats will seek to raise the debt ceiling with GOP support in the coming weeks. (Congress voted in July 2019 to suspend the debt limit until July 31, 2021, otherwise known as “kicking the can down the road”.)
Is action needed on America’s crumbling infrastructure? Certainly. Is it needed now? No. The US economy is recovering well from the pandemic, with about a 6.5% growth rate in both the first and second quarter. It doesn’t need the additional spending to goose growth, but it’s getting it nonetheless, along with an additional $3.5 trillion spending bill custom-fit to the Democratic Party’s progressive priorities.
Forbes does a nice job of explaining how the US national debt has gotten out of control, and this was written in May, before the $3.5T planned mega-spend.
Entitled ‘U.S. National Debt Expected to Approach $89 Trillion by 2029’, the piece makes some interesting points, along with three must-see graphs, reproduced below.
The author pulls no punches with the lead, stating that
The U.S. national debt is rising at a pace never seen in the history of America. With a current debt exceeding $28 trillion – an increase of nearly $5 trillion in 14 short months, Washington is now debating an infrastructure bill with a price tag close to [$1 trillion – Rick] Even without this additional spending, the national debt will approach $89 trillion by 2029 according to USDebtClock.org. This would put the country’s debt-to-GDP ratio at 277%, surpassing Japan’s current 272% debt-to-GDP ratio.
As we have previously written, the government’s propensity to spend began with President Nixon’s fateful decision to take the United States off the gold standard in 1971, freeing Congress up to spend, and as it’s turned out, overspend, in a big way.

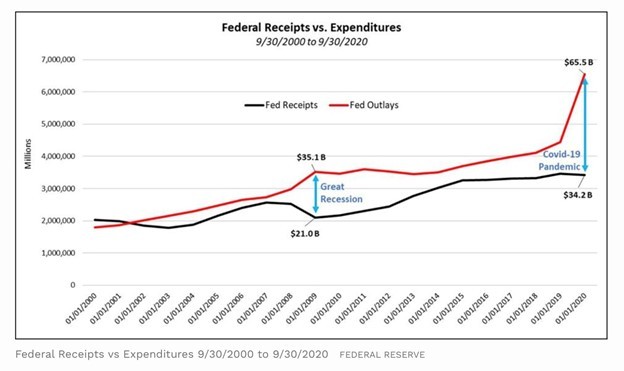
American’s surplus/deficit from 1901 to September 30, 2020. The vertical grey shaded areas indicate recessions/depressions.
As the graph below shows, in 2007 when Congress passed a series of spending bills known as quantitative easing (the first rounds of QE), expenditures were 67% of government revenues ($21.0B vs $35.1B). In 2020, the pandemic year, federal outlays of $62B exceeded receipts of $34.2B by nearly 92%.
With QE, a central bank purchases long-term securities on the open market in order to increase the money supply and encourage consumers and businesses to borrow. The policy also serves to lower interest rates by bidding up the prices of long-term bonds, and greatly expands the central bank’s balance sheet.
Indeed the Fed’s balance sheet — the amount of assets it has purchased in the name of keeping the flatlined economy on life support — has risen to an unprecedented $8.2 trillion – way beyond anything the Fed did in the months and years following the financial crisis.
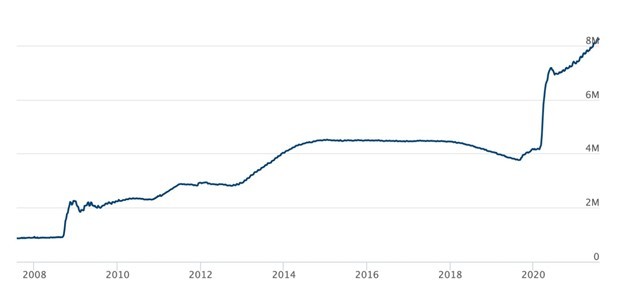
Assets held by the US Federal Reserve. Source: Federal Reserve
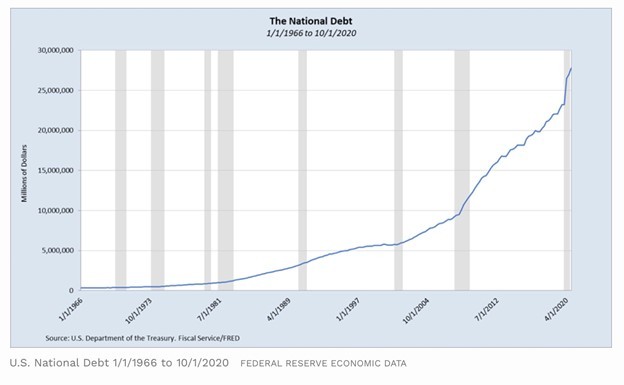
An even starker representation of ballooning debt appears in the next graph. It shows the US national debt on a fairly gentle upward slope until about 2010, when it suddenly takes off, the result of four rounds of QE plus deficit upon deficit piled onto the burgeoning national debt. As columnist Mike Patton rightly puts it, we are leveraging our future to stimulate today’s economy.
According to a 2011 research paper from the Bank of International Settlements – a bank and research hub owned by 63 central banks from around the world, when government debt-to-GDP exceeds 85%, future economic growth is reduced. With a current debt-to-GDP ratio of 127%, which is expected to rise to 277% by 2029, future economic growth will not be as robust as it has been in the past. The exception to this will be during an economic rebound following a recession, which is typical.
The last sentence is worth a follow-up. Optimists will point to the fact the economy is growing by 6.5%, and that this will help to lower the debt to GDP ratio. True, the economy is initially growing “after” covid (Is covid really done? Also, it’s not hard to do better than 2020’s horror show) later growth will be impeded by the ever-expanding national debt, which in turn is being fueled by out-of-control public spending.
Debt is clearly a major limitation on a growing economy.
According to the World Bank, if the debt to GDP ratio exceeds 77% for an extended period of time, every percentage point of debt above this level costs a country 0.017 percentage points in economic growth. We are currently at 128.6%, so that is 50 basis points multiplied by 0.017 = 0.85, nearly a full percentage point of economic growth!
The Balance notes that a combination of recessions, defense budget growth and tax cuts has raised the national debt-to-GDP ratio to record levels. Throughout the years, US military spending has been a major contributor to the debt. During the First Iraq War in 1991, the debt to GDP ratio hit 54%. Between 2001 and 2020, America’s War on Terror consumed $6.4 trillion, helping to elevate the debt to GDP ratio from 55% in the year of 9/11, to 127% in 2020.
In 1989, when real estate investor Seymour Durst created the debt clock and it was installed in New York City, the national debt was just $2.7 trillion and represented 50% of gross domestic product.
According to a second Balance article,
The debt clock faithfully recorded the increasing U.S. debt until 2000. That’s when the prosperity of the 1990s created enough revenue to reduce the federal budget deficit and debt. It seemed as if the debt clock had accomplished its goal.
Unfortunately, that prosperity didn’t last. The 2001 recession and the 9/11 terrorist attacks meant lower revenues and higher spending. That added more deficits to the debt. The Durst Corporation reactivated the clock in July 2002 when the debt reached $6 trillion. It took 10 years for the debt to double after its initial installation. When the debt exceeded $10 trillion in September 2008, one more digit was added. The $700 billion bailout raised it to $12 trillion in 2010.
The debt has hit a milestone every year since the Great Recession except 2015, and in some years (ie. 2019 and 2020) more than once. In 2012 the debt was $16 trillion, by 2018 it had risen to $21 trillion, and by October 2020, the debt was $28 trillion.
Consider this: the current national debt of $28.6 trillion, and the current debt to GDP ratio of 128.4%, doesn’t include the $1 trillion infrastructure bill heading to the House; nor the $3.5T anti-poverty and climate plan.
We also have to add the federal budget numbers. President Biden’s budget for full year (FY) 2022 totals $6.011 trillion, more than any other previous budget. The US government estimates that for FY 2022, revenues will again fall short of expenditures, leaving a $1.8 trillion deficit. Better than the projected $3 trillion deficit for 2021 — almost the same as last year’s $3T — but it still means nearly $2 trillion will be added to the national debt. (CNBC notes the budgetary shortfall this year is equivalent to 13.4% of GDP, the second-largest level since 1945 and exceeded only by 2020 spending)
Adding it all up, you get $28.6T (national debt) + $1 trillion (infrastructure bill) + $3.5T (anti-poverty and climate plan) + $6T (FY 2022 budget spending) + $3T (2021 deficit) + $1.8T (2022 deficit) = $43.9T. So there you have it. By 2022 the national debt, presuming all of the spending commitments use borrowed (or printed) money, will be approaching $44 trillion!
Yes, some of that $15.3 trillion will be paid for with un-used covid-19 relief money, but remember, half of the US population remains un-vaccinated and the Delta variant is gathering steam. More funding for hospitals, PPE and burnt-out health workers will almost certainly be required. On Sunday the nation’s top infectious disease expert, Dr. Anthony Fauci, reportedly said more Americans must protect themselves with the COVID-19 vaccine or else the deadly virus could develop yet another variant even “more problematic” than the highly contagious delta strain that’s sparked new cases and a wave of hospitalizations and deaths among the nation’s unvaccinated.
The way they’re going, it’s easy to see how usdebtclock.org is projecting that by 2029 the US debt pile will reach $89 trillion.
Some see the national debt going much higher, given that the way it is calculated now, doesn’t include unfunded Social Security and Medicare promises. When that $129 trillion worth of bills is added, “the truth” is closer to $133 trillion.
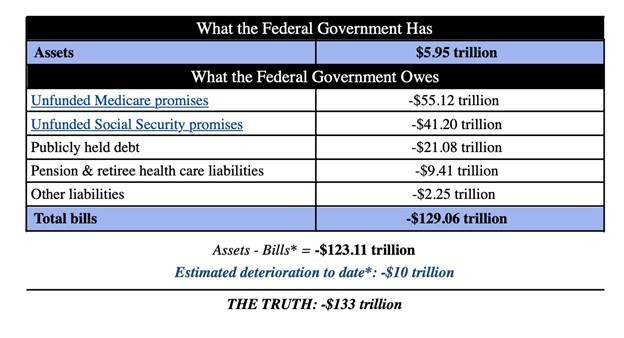
Source: Truth in Accounting
Dow to gold ratio
Where should a smart investor park their savings in this current market, where stocks are expensive and continued low interest rates make income-yielding investments a joke?
We offer two suggestions: commodities and precious metals.
The commodities super-cycle of the 2000s collapsed in the Great Recession of 2008, then resumed from 2009 to 2011. It ended in the bear market of 2011-15.
Many are pointing to the formation of a new super-cycle, driven not by fossil fuels and the rise of China, such as occurred in the 2000s, but by so-called “green” metals needed to electrify and decarbonize, to avoid the worst effects of climate change.
Gold (and commodities) is a hedge against inflation, so it is generally bought when inflation goes up, to guard against currency devaluation.
Higher inflation is good for gold especially if Treasury yields do not get too high, a situation that gives negative real interest rates. Historical charts prove that every time yields fall below the rate of inflation, ie. they turn negative, gold goes up. (we currently have negative real rates, ie. the 10-year US Treasury yield of 1.3% minus 5.4% inflation = -4.1%)
Also, there is a historically close correlation between gold prices and debt to GDP. The higher the ratio, the better it is for gold.
Currently we have monetary easing (monthly bond-buying, interest rates near zero) happening at the same time as generous fiscal spending (remember Biden believes strongly in the power of the state to tax and spend. A long wish list waits to be filled, with little to no concern regarding the already out of control $28.5 trillion national debt, courtesy of Modern Monetary Theory, or MMT).
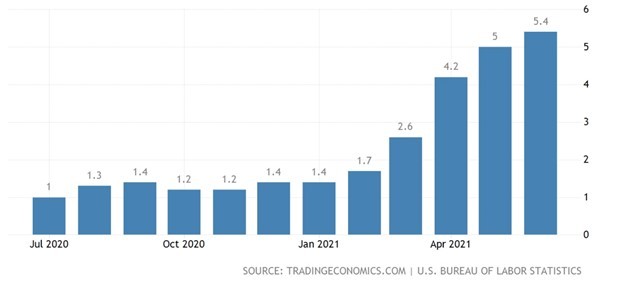
The result of these two forces acting together, is bound to create inflation, which has climbed to 5.4% in June.
All of this is background for introducing two concepts that help to predict the direction of gold prices, and to guide a decision on when is the best (and worst) time to buy gold versus stocks.
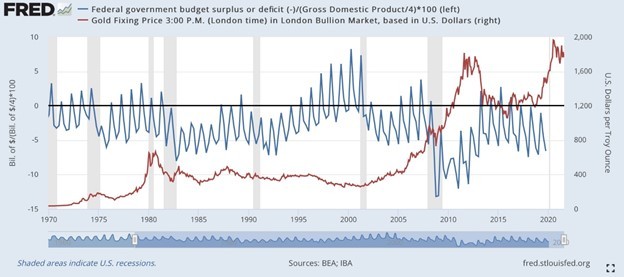
The FRED chart below compares the government surplus or deficit divided by the GDP, to the gold price, from the 1970s to present-day. We know there is a close relationship between gold prices and debt, so it’s no surprise to see when the government is in surplus (the blue line is above the black 0% line) gold shown in red tends to fall back. In contrast, gold starts climbing around 2000 when the blue line dips under the black line, corresponding to a return to deficits following the 2001 recession. Gold then moves considerably higher, culminating in its then-record $1,900 per ounce in 2011, while a long string of budget deficits last the better part of a decade. Readers schooled in technical analysis will see a strong cup and handle pattern building in the gold price at the upper right of the chart. The longer the handle shape prevails, usually it means the higher the gold price.
Next, we have the Dow to gold ratio, a measure of how many ounces of gold it would take to “buy the Dow”. The Dow Jones Industrial Average is a price-weighted index of 30 large corporations that represent the different sectors of the US economy, such as financial services, manufacturing and information technology. Examples include American Express, Boeing and Intel.
The Dow to gold ratio expresses the DJIA as a multiple of the price of one ounce of gold. So for example, if the Dow is trading at 35,000 points and the gold price is $1,750, the Dow to gold ratio is 20. As Zacks reports, the ratio has fluctuated widely over history, trading as low as 1.0 during the stock market crash of 1980 to above 40 during the dot-com bubble of 2000.
For investors, the ratio is valuable because it tracks how gold has performed relative to corporate America. It can also be used to determine whether the stock market is undervalued or overvalued, and most importantly, signals when is the time to jump in or bail out.
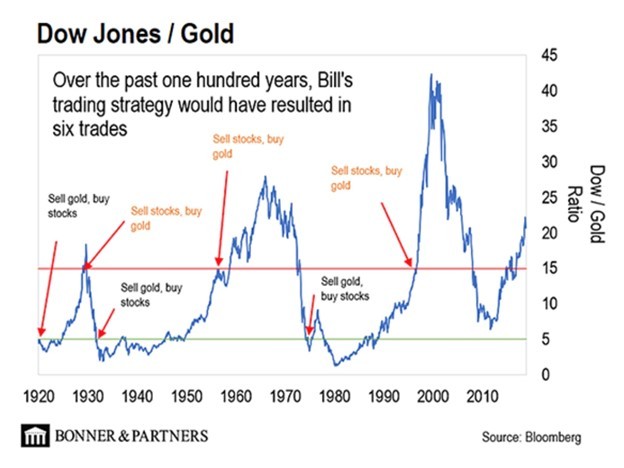
Here are the rules of a trade that has worked extremely well for the past 100 years: when the Dow to gold ratio goes below five, we buy equal shares in the Dow Jones Industrial Average (ie. we buy the index). When the ratio goes above 15 we sell the Dow and buy gold.
As the chart below shows, the Dow to gold trade, explained by Bill Bonner of Bonner & Partners, would have resulted in six trades over the past 100 years. In 1996 the Dow was at 5,729 and gold was priced at $382/oz. In February 1929, September 1958 and July 1996, the Dow to gold ratio hit 15, the time to sell stocks and buy gold. The opposite buy-sell signal occurred in September 1931 and April 1974. In these months the ratio dropped to 5, signaling it was time to sell gold and buy stocks.
In the next chart, the Dow to gold ratio is plotted over the past 200 years. In the fiat money era, past 1913, there is much higher volatility in the ratio, with highs higher and lows lower. For example, between 1960 and 1970, the ratio moved up to around 35, but fell dramatically between 1976 and 1980. That year, the ratio plummeted to -1.5. The ratio spiked higher during the economic recovery of the 1990s, almost reaching 50 in 2000, just prior to the dot-com crash.
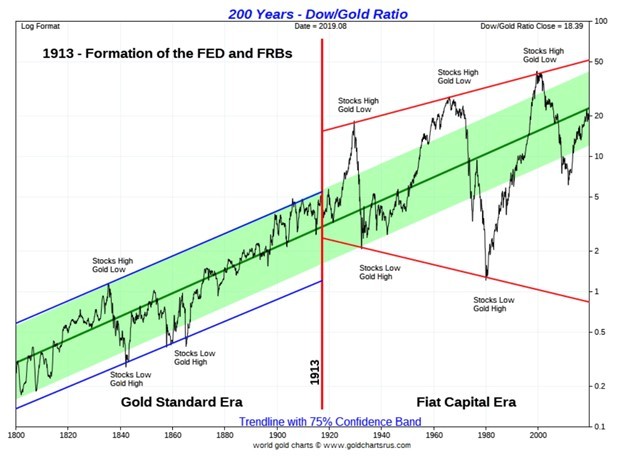
In fact, we can see that, at the end of every financial crisis, the Dow to gold ratio falls precipitously. From Bill Bonner’s chart above, notice in 2010 the ratio dropped to about 7, in 1980 it fell to 1.
The important point here, is that in each of the cases when the Dow to gold ratio moved higher than 15, stocks were in a bubble. During these periods the federal government and the US Federal Reserve will do practically anything to ensure that the bubble continues, including the present-day “quantifornication” policy of ultra-low interest rates and monetary easing. However, the fact is, they have never been successful in preventing a crash. There’s always a correction, it’s just a matter of when, and by how much. The Dow to gold ratio gives investors a vitally important signal as to when the stock market is overvalued and gives them a chance to sell before it’s too late.
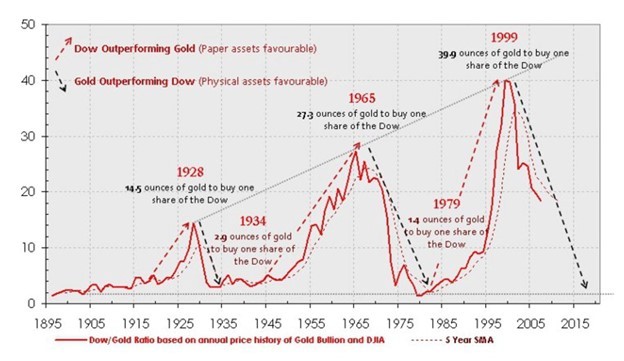
In the chart below, notice how the Dow is getting progressively more expensive — each bubble larger than the previous — over the past 120 years. In 1928 it only took 14.5 ounces of gold to buy one share of the Dow, in 1965 you needed 27.3 oz, and in 1999 39.9 oz were required.
Over the past 100 years there have been three opportunities to sell gold and buy the Dow, and three chances to buy gold and sell the Dow. We think there is a fourth “buy gold sell the Dow” opportunity coming up.
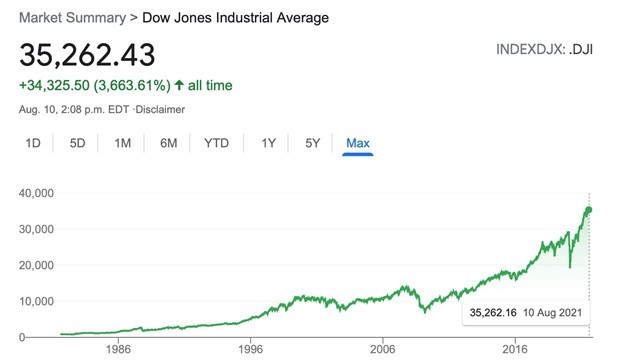
Consider: the current Dow to gold ratio is 20 (35,262/$1728 = 20.4), meaning it has already jumped five points higher than the recommended sell point of 15.
Now we don’t own the Dow but if we did, we would be dancing very close to the exit and buying gold (we are), which happens to be on sale right now after a $100 drop over the past six days.
The downside of this strategy is you might not capture all the gains of the current stock market bubble, but arguably, it’s better to leave a little money on the table, than to try to time an exit before the crash. If you guess wrong, you know it’s going to hurt.
Bill Bonner notes that selling the Dow to gold ratio when it hit 5 in 1929 would have meant a static gold price between 1929 and 1930, but it would have avoided the worst stock market crash in history. Similarly, by getting out of US stocks and into gold in July 1996, investors would have missed part of the bull market, but they also would have dodged the dot-com bust in 2000.
Conclusion
Bill Bonner’s strategy is based on a simple premise, that money is made by buying stocks when they’re cheap and selling them when they’re expensive. We completely agree. Nobody would dispute the fact that stocks are currently very pricey. The Dow currently sits at 35,262.43, for an all-time gain of 3,663%. Practically every day it sets a new record. The time to sell stocks is when they’re expensive, and the Dow to gold ratio tells us that they are currently overvalued. The rules of the Dow to gold ratio trade stipulate that we should sell the Dow at 15; at 20, stocks are getting bubbly. Time to head for the exits.
Make this argument to your stockbroker and he/she will tell you, “don’t do it. This market has further to run.” Fact is, you’re playing with fire by staying in the market, when the ratio is over 15. It’s written in the charts.
The last crash occurred in 2010, when the ratio fell from about 42 to 7. We don’t know when the correction will occur, by how much and for how long it will last, all we know is that there has never been an occasion when a stock market bubble indicated by a high Dow to gold ratio, hasn’t popped. Anticipating the crash and acting on it could save you hundreds of thousands, or millions, in lost equity value. For damn sure you had better be dancing very close to the exit!
So, what do we foresee happening? Despite the highly contagious Delta variant gathering pace in the US, the American economy is coming out of the pandemic and we’re getting a nice pop. Consumer spending is picking up, jobs are returning, and economic growth is a robust 6.5%. However, this will not continue much longer, in my opinion less then year, before growth levels off and drops to a more sedate pace.
From our earlier discussion on the debt, we know that the money-printing and borrowing will continue, and that the US Federal Reserve is constrained by the debt, in how much it can raise interest rates. With the national debt currently at $28.5 trillion and heading at minimum, well past $30T due to the Biden administration’s multi-trillion-dollar spending commitments, and possibly as high as $44T when federal spending plus the deficit as outlined in the 2021-22 budget is factored in, we think the Dow to gold ratio trade is definitely worth considering.
In fact, it might be the smartest trade out there right now. Rising inflation + continued quantifornication + negative real rates all spell higher precious metal prices, which is why we are focused on gold and silver juniors which offer the opportunity for spectacular shareholder gains when prices rise.
Also note, for the ratio to come back down to a more comfortable level, either the Dow must drop or the gold price must rise. I’m betting on the latter. According to Forbes the way it’s going, the debt to GDP ratio will keep climbing, from the current 128% to 274% by 2029 – that’s 3.4 points shaved off GDP growth over 9 years! Gold and silver thrive in high-debt environments, and the debt has no other direction to go but up.
Beyond precious metals, commodities offer a hedge against rising inflation. To capture this trend we are invested in quality juniors who are exploring for battery & energy metals such as lithium, nickel, graphite and copper.
There are so many reasons to be bullish on commodities and as we outlined in a previous article, a lot to indicate that inflation is not going away anytime soon, thus setting up the conditions for a multi-year commodities up-trend.
Richard (Rick) Mills
aheadoftheherd.com
Legal Notice / Disclaimer
Ahead of the Herd newsletter, aheadoftheherd.com, hereafter known as AOTH.
Please read the entire Disclaimer carefully before you use this website or read the newsletter. If you do not agree to all the AOTH/Richard Mills Disclaimer, do not access/read this website/newsletter/article, or any of its pages. By reading/using this AOTH/Richard Mills website/newsletter/article, and whether you actually read this Disclaimer, you are deemed to have accepted it.
Any AOTH/Richard Mills document is not, and should not be, construed as an offer to sell or the solicitation of an offer to purchase or subscribe for any investment.
AOTH/Richard Mills has based this document on information obtained from sources he believes to be reliable, but which has not been independently verified.
AOTH/Richard Mills makes no guarantee, representation or warranty and accepts no responsibility or liability as to its accuracy or completeness.
Expressions of opinion are those of AOTH/Richard Mills only and are subject to change without notice.
AOTH/Richard Mills assumes no warranty, liability or guarantee for the current relevance, correctness or completeness of any information provided within this Report and will not be held liable for the consequence of reliance upon any opinion or statement contained herein or any omission.
Furthermore, AOTH/Richard Mills assumes no liability for any direct or indirect loss or damage for lost profit, which you may incur as a result of the use and existence of the information provided within this AOTH/Richard Mills Report.
You agree that by reading AOTH/Richard Mills articles, you are acting at your OWN RISK. In no event should AOTH/Richard Mills liable for any direct or indirect trading losses caused by any information contained in AOTH/Richard Mills articles. Information in AOTH/Richard Mills articles is not an offer to sell or a solicitation of an offer to buy any security. AOTH/Richard Mills is not suggesting the transacting of any financial instruments.
Our publications are not a recommendation to buy or sell a security – no information posted on this site is to be considered investment advice or a recommendation to do anything involving finance or money aside from performing your own due diligence and consulting with your personal registered broker/financial advisor.
AOTH/Richard Mills recommends that before investing in any securities, you consult with a professional financial planner or advisor, and that you should conduct a complete and independent investigation before investing in any security after prudent consideration of all pertinent risks. Ahead of the Herd is not a registered broker, dealer, analyst, or advisor. We hold no investment licenses and may not sell, offer to sell, or offer to buy any security.
*********
 (Rick) Mills lives with his family on a 160 acre ranch in northern British Columbia. He invests in the resource and biotechnology/pharmaceutical sectors and is the owner of Aheadoftheherd.com. His articles have been published on over 400 websites, including: WallStreetJournal, USAToday, NationalPost, Lewrockwell, MontrealGazette, VancouverSun, CBSnews, HuffingtonPost, Londonthenews, Wealthwire, CalgaryHerald, Forbes, Dallasnews, SGTreport, Vantagewire, Indiatimes, Ninemsn, Ibtimes, Businessweek, HongKongHerald, Moneytalks, SeekingAlpha, BusinessInsider, Investing.com and the Association of Mining Analysts.
More from Gold-Eagle


