Gold Bear Market Losing Momentum


 It's constructive to look at the other side of your positions to see where you might be wrong. If you're long a market a good way to do this is by taking the inverse of the symbol representing your position. At stockcharts.com, you do this by putting "$ONE:" in front of your symbol and it shows you a chart of the inverse of your position.
I like to do this instead of looking at the leveraged ETFs because they tend to decay over time. The non-leveraged inverse ETFs are fine but they don't exist for many markets. Therefore using "$ONE:" gives you the bear market perspective of anything you want to look at.
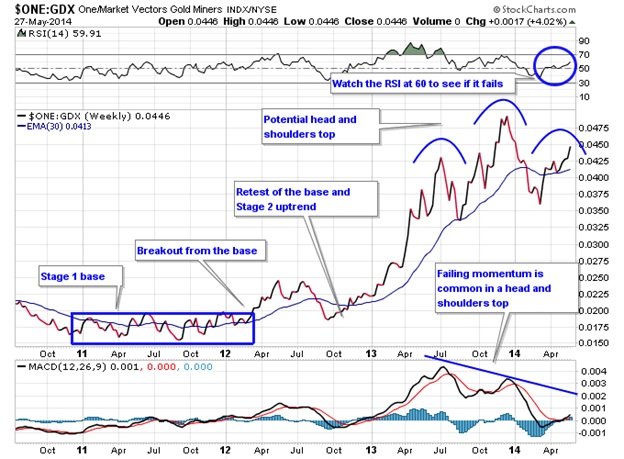
Let's take a look at the bear market in gold stocks that launched in 2011 by looking at $ONE:GDX. From a Stage Analysis perspective you can see a nice Stage 1 base that developed in 2011 followed by a breakout of the base in 2012. Then the bear market in gold stocks retested the base which happens a lot in early Stage 2 transitions. After the retest the bear market was off to the races in 2013 with the recent high occurring in December 2013. Notice though that in 2014 we are now seeing the 30-week moving average flatten out, and a head and shoulders topping formation has shown up on the chart. This is classic Stage 3 topping action.
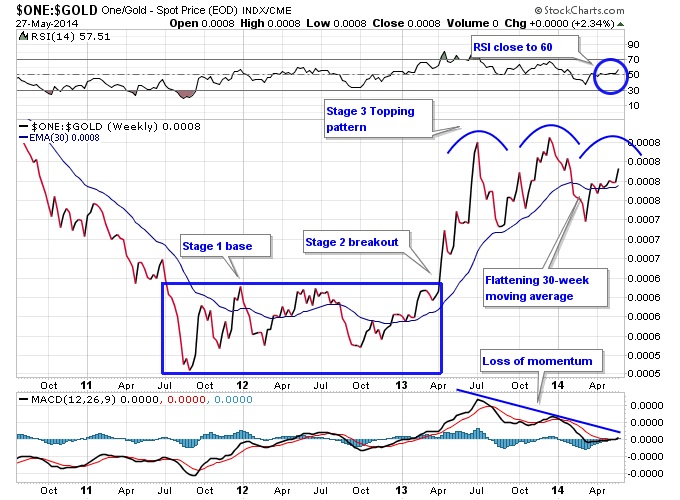
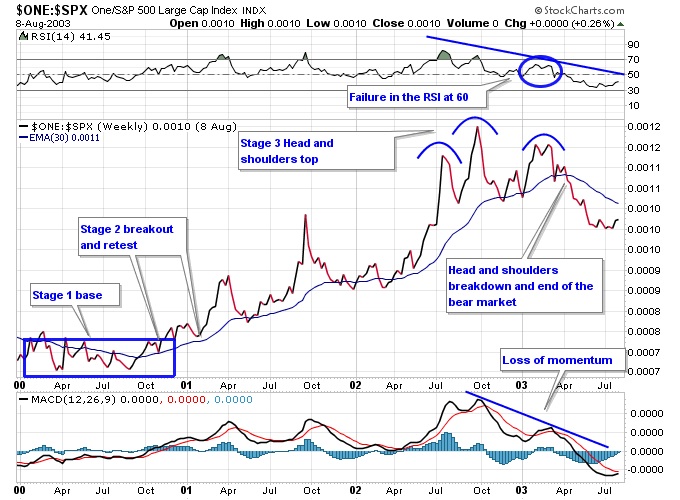
An analog I like to the current bear market in gold is the bear market in the S&P 500 from 2000 to early 2003. First we saw the breakout into a Stage 2 in early 2001 after a year long Stage 1 base in 2000. Then by late 2002 the bear market started losing momentum and a Stage 3 head and shoulders top started forming. Notice how momentum in the MACD made lower highs, just like we are seeing in gold and gold stocks currently. The RSI also failed to take back the 60 level by the end of the right shoulder, which is right about where we are at with gold and gold stocks currently. So we're at a similar juncture in gold and gold stocks to where the bear market in the S&P 500 finally failed in 2003 and transitioned back into a bull market.
Bear markets thrive on momentum because momentum to the downside produces fear. Heightened fear causes people to sell for preservation of capital purposes, and to ignore the ability to buy (https://www.gold-eagle.com/article/it-pays-wait-big-opportunities ) . With gold there is a natural floor to how far gold can go down. It can't go to zero, unlike over-leveraged banks, or non-profitable tech companies. They can go to zero. Mining stocks can go to zero if they go bankrupt and can't produce gold profitably at low prices. Exploration stage mining companies are especially vulnerable in gold bear markets because investment capital dries up and that is the only lifeblood they have to find gold.
A return to value is the result of a bear market, but as long as fear remains heightened the bear market can perpetuate and produce even greater value until the fear is dissipated. So a loss of momentum in the gold bear market is a potential catalyst for the end of the bear. We're at a critical juncture and even though fear is ramping up again in the gold sector, in reality the bear has work to do to keep going.
Connect with me on Twitter: @nextbigtrade
The original article and much more can be found at: http://www.nextbigtrade.com
The views and opinions expressed are for informational purposes only, and should not be considered as investment advice. Please see the disclaimer.


