Gold Breaks Out Upside From Its Bullish Cup And Handle Pattern. Now What?


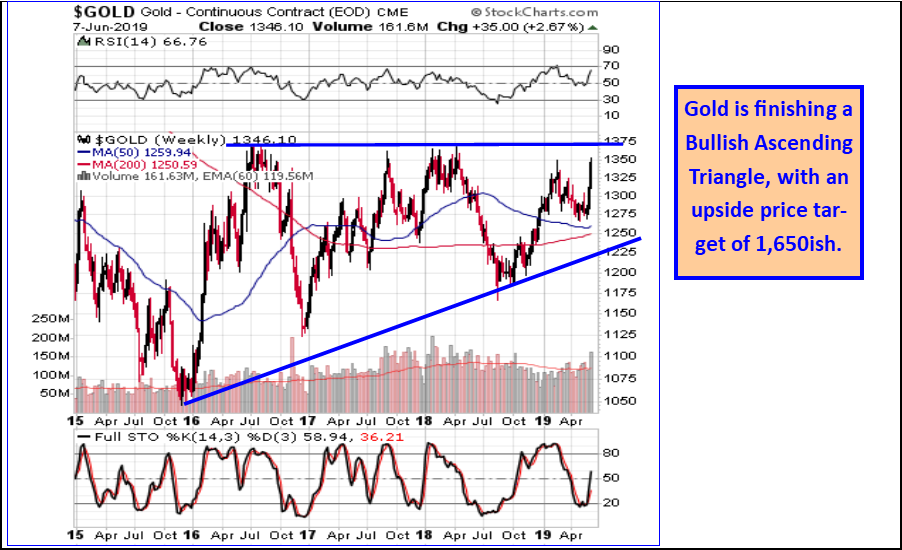
We are seeing positive charts for Gold, with several different patterns and wave mappings confirming the Bullish case. They all have an upside price target for Gold of 1,600 to 1,650ish over the coming months. Let’s take a look.
The first pattern we show is an Ascending Bullish Triangle.
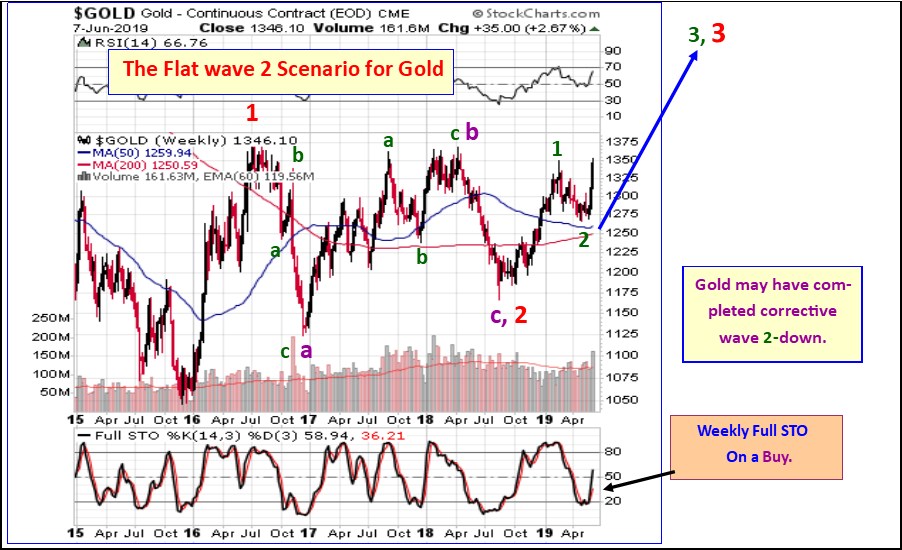
Below we see an Elliott Wave mapping chart that breaks down the moves for this Ascending Bullish Triangle, which confirms a powerful wave 3-up of 3-up move is starting in Gold. Wave threes are usually dynamic.
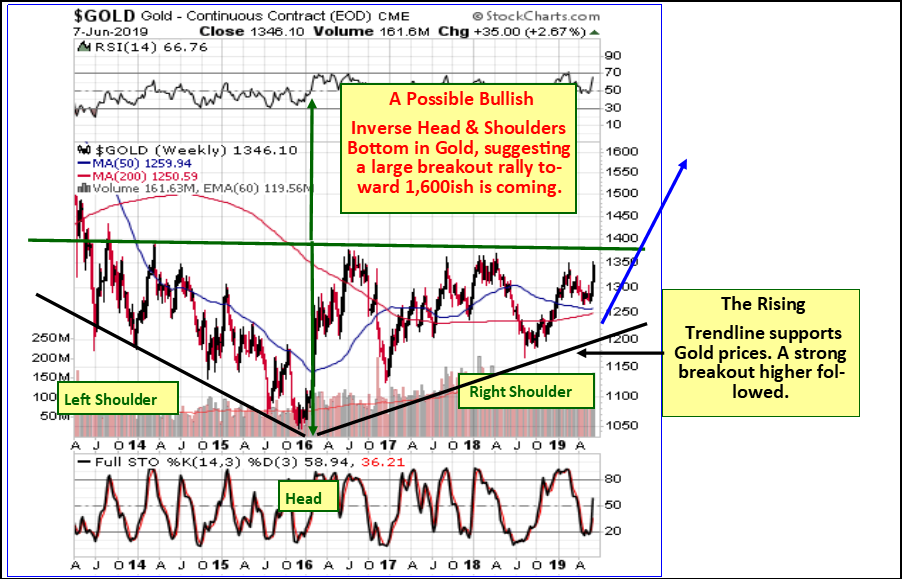
Above we see there also is a massive Bullish Inverse Head & Shoulders bottom pattern which is complete. This pattern measures the collective psychological state of mind for Gold investors everywhere. It projects an upside price target of 1600 to 1650 over the coming months.
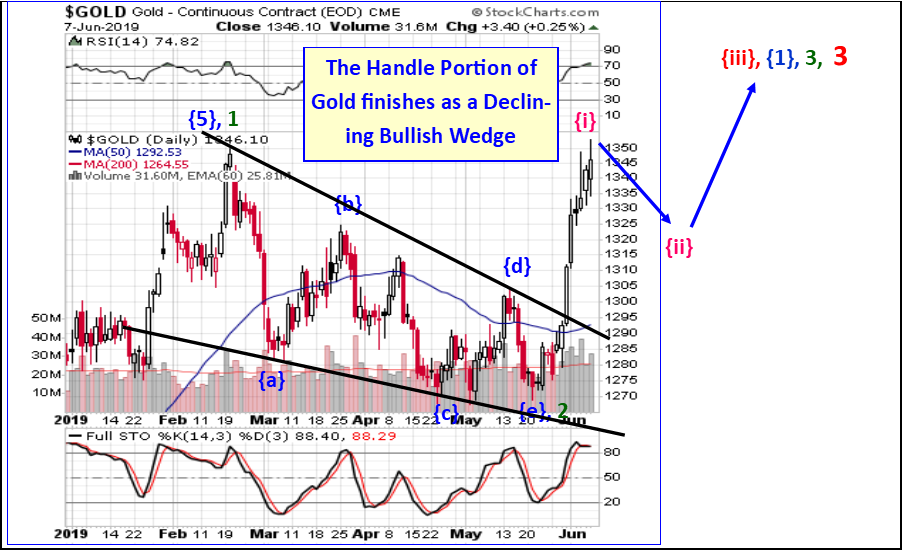
Next we see that Gold just finished its large degree Bullish Cup and Handle pattern, completing the final portion of the pattern, the Handle, which also happens to be wave 2-down of 3-up. Gold has broken out sharply above the Handle. This pattern breakout was expected for weeks as we monitored its completion, and means Gold will rise sharply toward at least 1,600ish inside wave 3-up. That rally has started.
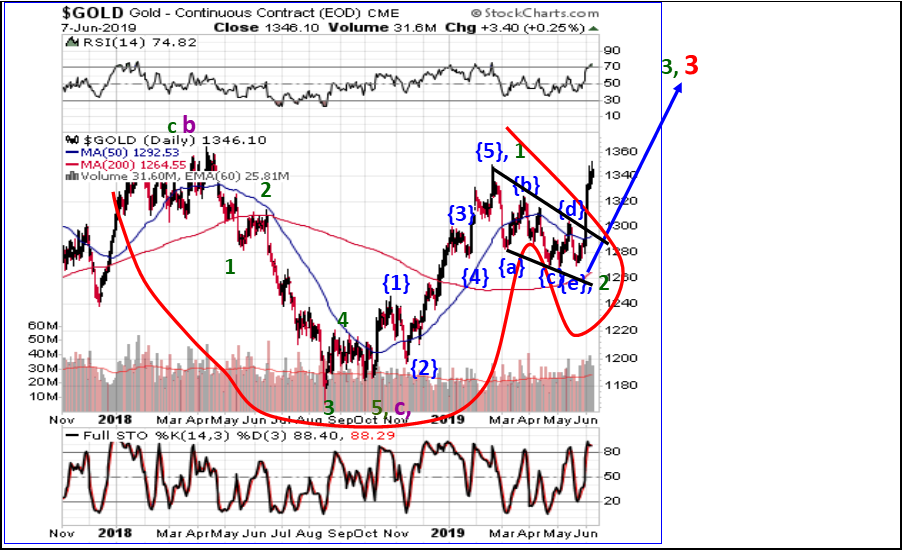
The next chart below shows Gold’s upside breakout Friday, May 31st, taking Gold decisively above the upper boundary of a Declining Bullish Wedge, which acted as the Handle portion of a Bullish Cup and Handle pattern. This is strong evidence that the Declining Wedge is complete, which means the Handle is complete, which means the Cup and Handle is complete, and means Gold will now start rising sharply toward at least 1,600ish inside wave 3-up.
Great news at long last for Gold bugs. Probably not so good for the stock market, or for world peace and security. Watch out for the end of June, as our stock market charts shown to our subscribers in our U.S. Weekend Market Report at www.technicalindicatorindex.com warn trouble could be coming.
At McHugh’s www.technicalindicatorindex.com we are celebrating our 16th Year Anniversary this June, 2019. We started publishing technical analysis newsletters back in June 2003. Over this period of time, we have had the pleasure of serving more than 20,000 different subscribers at one time or another. Our members have run the gamut of university students, Professors, individual investors managing their own portfolios, professional Money Managers, Hedge Fund Managers, and a few "who's who" multi-billionaires everyone would recognize.
We have always tried to provide an array of services that meet the needs of most investors and traders.
Some history: We started out providing a U.S. Daily and Weekend Market Forecast newsletter back in 2003, which included our proprietary key trend-turn identifier indicators, the Purchasing Power Indicator, the Secondary Trend Indicator (which was originally known as our Technical Indicator Index), Primary Trend Indicator, and Demand Power / Supply Pressure Indicator. We added Elliott Wave Mapping and Investor Psychology-determining Pattern charts, our proprietary Phi Mate Turn date cycle trend turn identifier, and a host of other key indicators such as Hindenburg Omens and Bradley model turn dates.
In 2005 we started an additional newsletter, a separate International Stock Market newsletter, and have continued to add major stock indices to this report. We added a Conservative Portfolio model in October 2006 in anticipation of the coming Great Recession (which outperformed the S&P 500 by over 50 percent during that economic collapse). In 2011 we added a Platinum Trading Program primarily trading speculative Options on underlying Exchange Traded Funds on major markets. In 2016, we added more conservative Exchange Traded Funds Trades to our Platinum membership program.
I decided to start this Technical Analysis business after leaving my previous life in corporate banking where I started a commercial bank from scratch and guided it as Chief Operating Officer to a size of several $billion in little over a decade. During that time I personally managed a securities portfolio over one billion $, and served as President of the Investment company. In doing so, I quickly came to realize that markets too often did not move in concert with economic news, and that these strange things called technical analysis reports that came across my desk were incredibly accurate at forecasting trend turns, both short and long term.
Intrigued and convinced, after the commercial bank was sold, obtained my Ph.D degree in Finance, with a concentration in Technical Analysis, where I developed many of the indicators that presently appear in our newsletters. I came to know and respect many of the legends of the unique "out-of-the-box" Technical Analysis of Markets profession. Many of those great men have passed on, and fortunately many remain active in the business. The one constant has been that this science of technical analysis of markets is a huge tool to generating investment and trading profits, and enhancing portfolio performance.
So again, after sixteen successful years, and always exciting and entertaining times it seems, it has been a pleasure. Our thanks to Gold-Eagle.com for partnering in our growth.
*********


