Gold Is Copper???


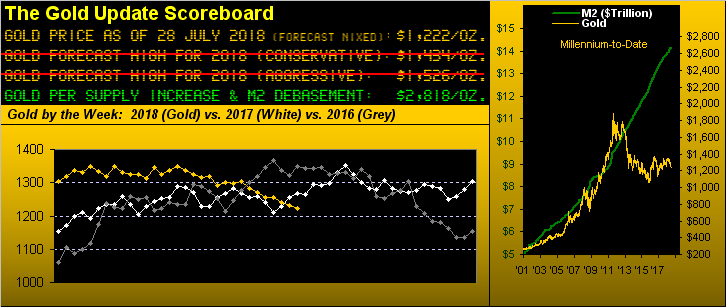
A week ago from the high mountains of Squaw Valley we nixed our forecast for gold to reach 1434 this year. 'Tis clearly evident not just by all the substantive overhead resistors -- notably The Box (1240-1280), The Whiny 1290s, and The 1360s Double-Top -- but as well by gold's weekly track for this year per the above Scoreboard: consistently down and without a wit of effort to even turn up to test any of said resistance. Drip, drip, drip...
Indeed, gold dripped down to record a sixth closing weekly low for this year in just these last seven weeks, settling yesterday (Friday) at 1222. The one wee bright spot is that the low price for the week (1217) was higher than the low price of the prior week (1211). Big wup. 'Tis frustrating enough being sub-The Box:

But as stated a week ago: "Yes 'tis 'dollar strength'; yes 'tis higher rates; yes 'tis America lookin' great." And believe the data or not, the StateSide Gross Domestic Product growing at an annualized 4.1% rate for Q2 is pretty great. "We don't need no stinkin' gold!" Just you wait ... or as a core reader of The Gold Update wrote in this past week: "Joe Consumer is borrowing a hamburger today that he hopes to pay for tomorrow. Unsustainable." And he doesn't even get fries with that.
Either way, here's the latest view of the Economic Barometer, the green portion of the line noting the recording period for Q2's metrics. Up with the GDP, down with Home Sales. And with still over two months to run in Q3 ... what will we see?
Here's something we didn't see. Remember our closing reference a week ago to the "Copper Shocker"? We may be last on the planet to learn of this ... but then again perhaps not. Here's the deal:
At our Sunday Investors Roundtable two weeks back, a valued member of our esteemed assemblage, (who for purposes of this widely-read missive we'll keep anonymous), had just returned from an economic conference, (the locale for which is best kept anonymous), where a speaker (who by conference rules must kept anonymous) waxed in eloquence upon the positive correlation for the directional tracks of gold and copper. "WHAT?!?!?"
For those of you who already "get this", feel free to skip down a few paragraphs. To be honest, we've never heard of it, let alone even considered it, for arguably, it makes no sense. Intuitively, precious metal gold rises in times of monetary creation for economic stimulation, meaning that industrial metal Copper must be suffering given economic degradation. Inverse correlation, right? Wrong! Now just stay with us:
A hallmark of the website is the interactivity of the BEGOS Markets, the Bond representing the cost of money, the Euro the cost of cross-border business, Gold the mitigant against debasement of all currencies, Oil the cost of energy, and the S&P 500, the earnings for which are subject to all of these markets' machinations. And the pricing of each of these markets affects one another. To wit, the website's Market Values page, (wherein at this writing we find gold some 50 points below its smooth valuation line relative to where the other four markets suggest it "ought be"). But specific to copper, which we categorize as a "secondary" market within the BEGOS Mix, we don't include it in the BEGOS valuation process. Anyway...
Upon hearing this bit about the positive tracking correlation between gold and copper, we -- for the first time ever -- assembled a chart of these two markets by the day from the depths of the Black Swan nearly ten years ago through yesterday (27 July 2018). And we received quite a shock when we saw the result:
"That's a pretty tight picture, huh, mmb..."
'Tis understatement, "tight", Squire:
So tight, and yet so far apart by price: as noted, gold settled yesterday at $1,222/oz.; Copper settled at $2.796/lb., or 17.48¢/oz. Meaning that 6,990 ounces of copper equates to one ounce of gold. And yet the positive pricing correlation of the yellow precious metal to the red industrial metal is stunning. Moreover, inflation -- be it stark or stealth -- ain't helping either metal. Stunning indeed. The "Copper Shocker". Lift jaw from floor and let's continue.
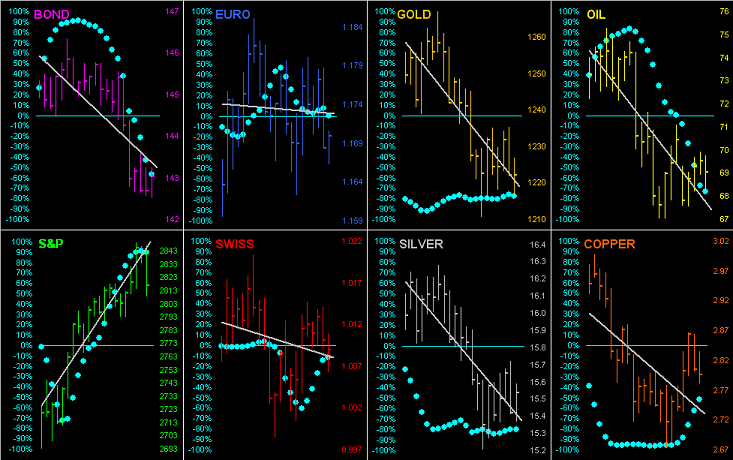
To be sure these days, save for the "We Never Really Go Down" stock market, the balance of the BEGOS Markets -- like and including gold -- are all sporting negative 21-day linear regression trends, to which as we've quipped in the past: you know the Dollar is rising without having to look at its chart. Below we go 'round the horn for our eight markets over the past 21 days, the "Baby Blues" indicative as to whether the diagonal trendlines are increasing or decreasing their directional consistency. Makes one consider 'tis not just copper, but rather all of the other markets (ex-stocks) that gold is imitating as it gets kicked down the road with the rest of the "commodities":
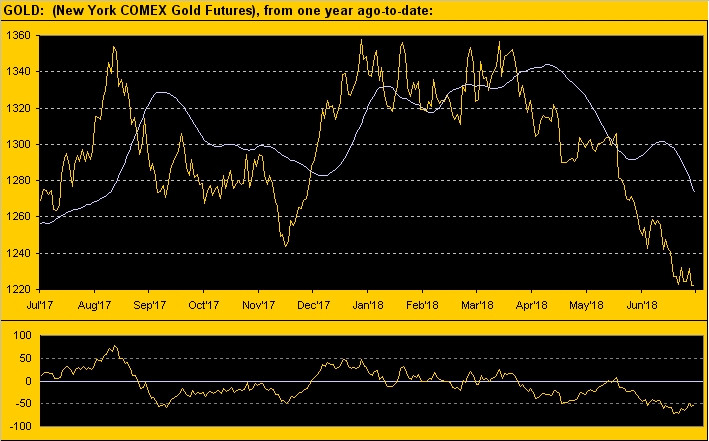
As noted with respect to gold's being some 50 points below its smooth valuation line, here from the Market Values page is that full-year graphic, (not to be confused with the Scoreboard's independently valuing Gold solely by Dollar debasement, adjusted for tonnage). Simply said: the smooth line here suggests where gold "ought be" based on the interrelationship of its movement with and by those of the other four primary BEGOS Markets. And as you can see per the oscillator (price less valuation) across the foot of the graphic, upon gold getting this low (-50 points), a rally typically ensues:
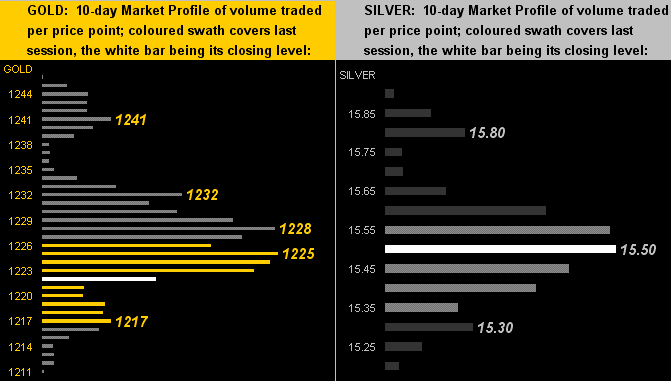
'Tis therefore appropriate, should gold attempt a rally, to "know" where the overhead sticking points lie. So here next is the 10-day Market Profile for gold on the left, along with otherwise left-out Sister Silver on the right. And for the yellow metal, 'tis really a rally back up into the 1230s that gives price a chance to at least test the underbelly of The Box (1240-1280), the depicted 1241 resistor no doubt lying in wait with a large shield to then punch price back down. As for the white metal, she's merely happy to have not been fully forgotten, the Gold/Silver ratio still sitting in rarefied historical air at 78.8x:
More broadly, let's go down, (literally) the stack:
The Gold Stack
Gold's Value per Dollar Debasement, (from our opening "Scoreboard"): 2818
Gold’s All-Time High: 1923 (06 September 2011)
The Gateway to 2000: 1900+
Gold’s All-Time Closing High: 1900 (22 August 2011)
The Final Frontier: 1800-1900
The Northern Front: 1750-1800
On Maneuvers: 1579-1750
The Floor: 1466-1579
Le Sous-sol: Sub-1466
Base Camp: 1377
2018's High: 1369 (11 April)
The 1360s Double-Top: (1362 in Sep '17 and 1369 in Apr '18)
The 300-Day Moving Average: 1292 and falling
Neverland: The Whiny 1290s
The Box: 1280-1240
The Weekly Parabolic Price to flip Long: 1272
10-Session “volume-weighted” average price magnet: 1228
Trading Resistance: 1225 / 12287 / 1232 / 1241
Gold Currently: 1222, (expected daily trading range ["EDTR"]: 13 points)
Trading Support: 1217
10-Session directional range: down to 1211 (from 1246) = -35 points or -2.8%
2018's Low: 1211 (19 July)
In closing, we're more convinced than ever (as certainly are most of you astute readers) that the child-managed FinMedia is setting records for short memories. Try this:
"The S&P 500 just ended its longest stint in correction territory since 1984. The S&P 500 is back in business. The broad-market benchmark ended its longest period in correction in about 34 years..." Well thank you, Dow Jones Newswires. Clearly in looking back those 34 years, they missed the 50%+ correction which began in March 2000 and bottomed 2 1/2 years later in October 2002. Then too was missed the other 50%+ correction which began in October 2007 and bottomed 1 1/2 years later in March 2009. Think they need to print a correction? They ought well do before the current correction of 25% runs its course down to 2154.
Speaking of corrections, the Top Five stocks in the S&P 500 by capitalization are Apple, Amazon, Microsoft, Google and Facebook. Gone are the days of JP Morgan Chase, or Exxon Mobile, leading the charge. From risk stability to risk fragility. And on Monday of this past week, Facebook, which at the time ranked fourth, announced its acquisition of 600,000 square feet of office space in London's Kings Cross, such as to house 6,000 workstations. Given the company's median salary of $240,000, the stampede to get one of those positions must be thunderous! But then come Thursday, the company's stock "slipped" from fourth to fifth in the S&P cap-weighting rankings. That's what a 19% single-day loss can do. Then that afternoon we were graced with the presence of a long-time tennis club friend and subject loss was mentioned. We went on to point out as well that Twitter, another S&P 500 constituent, was at that time sporting a price/earnings ratio of 4,178x. 24 hours later, that was reduced to 3,412x, the stock taking a 20.5% hit.
The bottom line is: it doesn't take much in this ridiculously over-valued equities environment to cause a train wreck. Remember: sell high! Moreover: buy low! Got Gold??? (Or maybe even some copper? Or the accelerator-in-waiting Silver?)

Mark Mead Baillie has had an extensive business career beginning in banking and financial services for two years with Banque Nationale de Paris to corporate research for three years at Barclays Bank and then for six years as an analyst and corporate lender with Société Générale.
For the last 22 years he has expanded his financial expertise by creating his own financial services company, de Meadville International, which comprehensively follows his BEGOS complex of markets (Bond/Euro/Gold/Oil/S&P) and the trading of the futures therein. He is recognized within the financial community of demonstrating creative technical skills that surpass industry standards toward making highly informed market assessments and his work is featured in Merrill Lynch Wealth Management client presentations. He has adapted such skills into becoming the popular author each week of the prolific “The Gold Update” and is known in the financial website community as “mmb” and “deMeadville”.
Mr. Baillie holds a BS in Business from the University of Southern California and an MBA in Finance from Golden Gate University.


