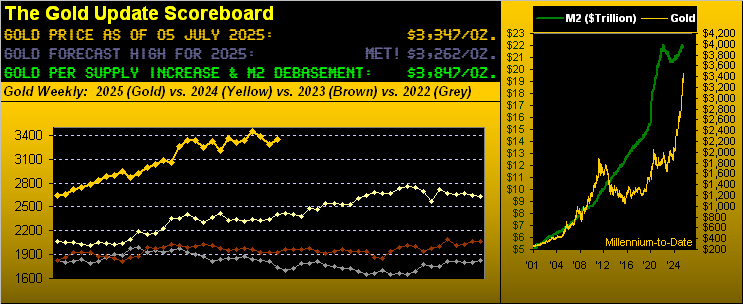
Gold’s ‘Weak’ Up Week … and What We Bespeak


Through this year’s 27 trading weeks-to-date, the most recent one for Gold posted a unique set of parameters not yet recorded during 2025. Ready?
- Gold’s high for the week (3377) was lower than that prior (3414);
- Too, Gold’s low for the week (3251) was lower than that prior (3267);
- And yet, Gold’s “settle” yesterday (Friday) at 3347* was higher than that prior (3286).
*We acknowledge that Friday’s trading session — given the StateSide holiday — is for settlement this Monday (07 July); thus the “official” weekly settle for Gold was Thursday’s 3336; however to keep you on the cutting edge of being properly informed, let’s go with Friday’s 3347, (because — for you WestPalmBeachers down there — Friday was after Thursday).
“But by that accounting, a +60-point gain for the week isn’t ‘weak’, mmb…”
To your point, Squire, we can wryly agree. ‘Tis just that — generally speaking — lower highs and lower lows oft lead to still lower levels; thus ’twas a “weak week” perhaps in a leading sense. And previous to this, Gold had not posted a lower weekly high and lower weekly low for a net up week since that ending 11 October 2024 … we tend to notice little things like that.
Either way, what does it all mean? Naturally none of us surely know, albeit after having last happened those 38 weeks ago in October, mid-November then found Gold some -132 points even lower, (just in case yer scoring at home).
So, is that relevant in this case? No fundamentally, given Gold broadly has so much higher to go. Yet technically, this imbroglio may spell more downside to go per Gold’s weekly parabolic trend as we next show:

Close inspection of the chart’s rightmost two bars depicts the lower highs and lows (red lines) yet the net upswing in price (green line). Too much information perhaps, but ’tis an unusual occurrence; and just because it led to still lower prices last time, hardly does that predict same this time. Regardless as noted, whilst the U.S. yesterday celebrated its 249th anniversary of independence, Gold gained those additional +11 points from 3336 to 3347 in commencing Monday’s session on Friday. Got it? Great.
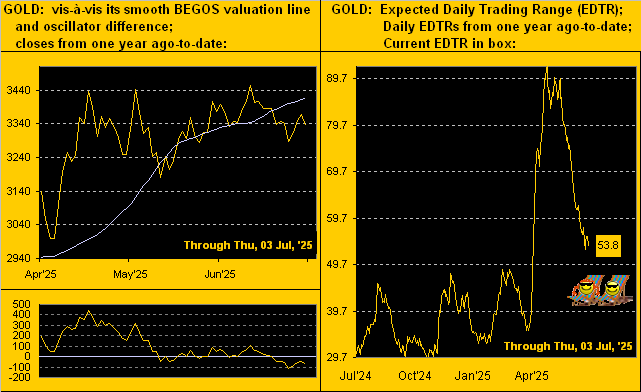
Next let’s graphically state how Gold is trading of late. The following two-panel display is culled from the website as updated each trading day. Regular readers shall recognize on the left our comparing Gold to its smooth valuation line from three months ago-to-date, borne of price’s changes to those of the other primary BEGOS Markets (Bond / Euro / Gold / Oil / S&P). Price being below the smooth line (by points per the oscillator) is suggestive of lower levels near-term, the actual signal of course coming upon Gold having crossed beneath the line back on 24 June from 3372. And on the right we’ve Gold’s EDTR (“Expected Daily Trading Range”) by the day from a year ago-to-date. Amongst tariffs scuffles and geo-political troubles, the EDTR ran as high as 92.4 points back on 28 April, from which to today ’tis nearly halved such expectation to 53.8 points. The notion is that much of Gold’s trading energy of late is dissipating, just in time for summer vacation:
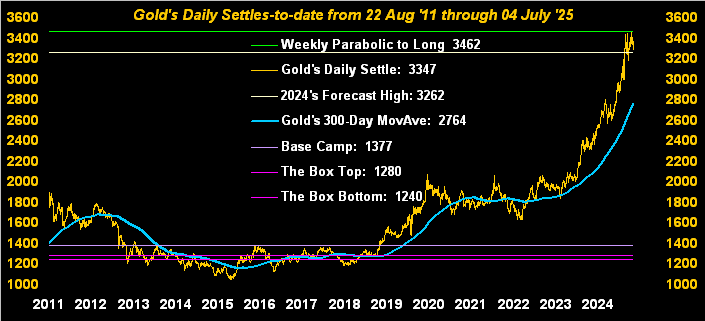
‘Course on the grandiose scale of daily settles across these past 14 years, Gold is looking — well — Grand! A concern however over Gold at present being nearly +21% above its 300-day moving average is that — historically — such percentage premium (or even higher) leads “on average” to a -8% fall in price within the ensuing 63 trading day, (i.e. one calendar quarter). In round numbers from here, that’d be a drop of some -270 points; not a prediction, rather just something of which to be aware:
Next let’s inject a little fun. (Note: per the website’s disclaimer and indeed under Monégasque law, we cannot, let alone are we licensed, to make formal trading recommendations). Rather, the following is merely 100% hindsight from our daily internal work, (and as with all trading studies the following two examples shall eventually morph from profit into loss). But as we’ve the Market Rhythms page on the website, here are two Gold technical studies which to date have been doing well: on a 10-test basis ’tis the six-hour MACD (“moving average convergence divergence”), whilst on a 24-test basis ’tis the four-hour Parabolics. “Pure swing consistency” means literally that: perpetually swinging back and forth on the signals from Long to Short (the latter as we oft quip “being a bad idea” with Gold). Again as said, these signals eventually will fail, (just as will your ability to sit in front of the trading screen 24-hours per day for months on end): yet to-date of late they’ve been pretty great … but you’re own your own, mate:
Still not so great is the Economic Barometer. Worse, it’s abject decline is compounded by the S&P 500 in absolute ignorance going the wrong way. (Note the wee rightmost down hook by the S&P: that accounts for the S&P futures selling off whilst StateSide folks were having their “Friday the 4th” BBQs).
As to this past week, 12 metrics came into the Econ Baro, of which period-over-period six improved and six weakened. Highlighting it all was this from the “In Whom Do You Believe Dept.”: the Bureau of Labor Statistics found June’s Non-Farm Payrolls to have increased, beating consensus, with those for May revised upward; but by ADP’s Employment data, June Jobs actually shrank, missed consensus, and found May revised lower. You cannot make this stuff up … regardless, the Baro remains way down:
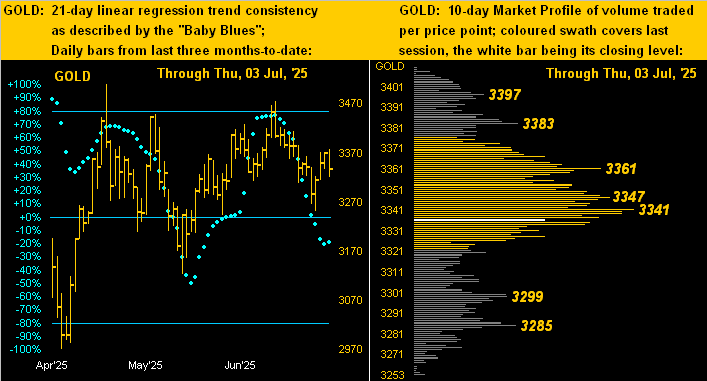
Near-term, back to Gold we go. Below on the left are the yellow metal’s daily bars from three months ago-to-date along with the baby blue dots of regression trend consistency, of which now there is very little, such trend having rotated to negative. And on the right in the 10-day Market Profile (which does not include Friday’s volume as ’tis reserved for Monday’s settle), obviously there is more overhead resistance versus underlying support:
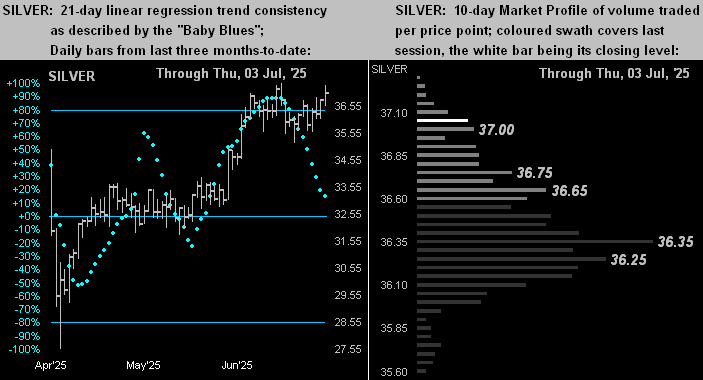
As for the white metal, at left the trend is still positive, albeit weakening as the “Baby Blues” fall. But by her Profile at right, Silver appears more supported than does Gold. ‘Course with the Gold/Silver ratio at 90.1x (the century-to-date average being only 69.1x), Sweet Sister Silver has a Long (pun intended) way to grow:
Thus as the U.S. concludes its third holiday-shortened trading week of the last six (they’re getting a bit like France in that respect), Monday ’tis back to work right up to Labor Day (01 September). But for the Econ Baro, next week brings really encouraging news: just a wee four metrics are due such that the Baro likely doesn’t get bruised. Thus let the complacency keep all enthused as The Investing Age of Stoopid continues! Just don’t lose your shoes…
Dem dogs r’ Gold-Smart!
Cheers!
…m…
www.TheGoldUpdate.com
www.deMeadville.com
and now on “X”: @deMeadvillePro

Mark Mead Baillie has had an extensive business career beginning in banking and financial services for two years with Banque Nationale de Paris to corporate research for three years at Barclays Bank and then for six years as an analyst and corporate lender with Société Générale.
For the last 22 years he has expanded his financial expertise by creating his own financial services company, de Meadville International, which comprehensively follows his BEGOS complex of markets (Bond/Euro/Gold/Oil/S&P) and the trading of the futures therein. He is recognized within the financial community of demonstrating creative technical skills that surpass industry standards toward making highly informed market assessments and his work is featured in Merrill Lynch Wealth Management client presentations. He has adapted such skills into becoming the popular author each week of the prolific “The Gold Update” and is known in the financial website community as “mmb” and “deMeadville”.
Mr. Baillie holds a BS in Business from the University of Southern California and an MBA in Finance from Golden Gate University.


