Gold Cycles In Bottoming Range, Prepping For Rally


Last week's trading saw gold generally holding weaker, with the high for the week made with Monday's tag of the 1745.80 figure (June, 2020 contract). From there, the metal turned weaker, here dropping all the way down to a Friday low of 1676.00 - before seeing a decent bounce off the same to end the week.
Gold's Near-Term Outlook
As mentioned last weekend, the short-term cycles were toppy for gold, with the main cycle responsible for that top being our 10-day wave, shown again on the chart below:
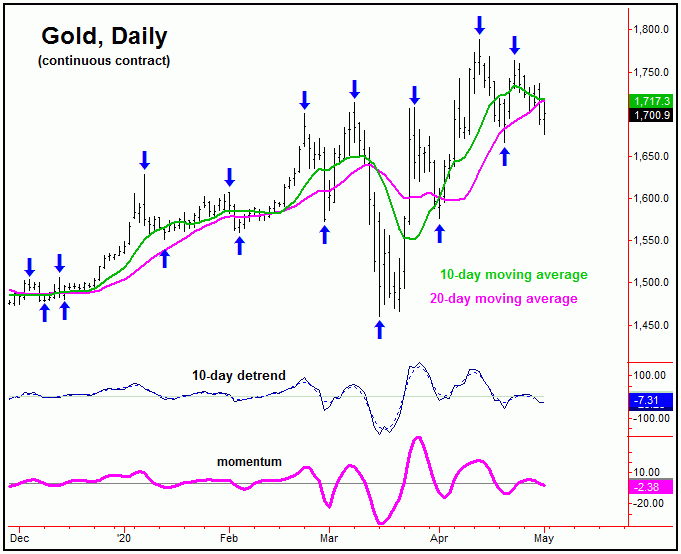
From last weekend: "our next short-term peak should come from this 10-day wave, which I am favoring to end up as countertrend - against the 1788.80 swing top. In other words, we should be at or nearing another decent swing top with the smaller-degree waves."
In terms of patterns, as mentioned, the most recent upward phase of the 10-day cycle was expected to end up as a countertrend affair - holding below the 1788.80 swing top. That action did come as expected, with gold halting its last rally with the tag of the 1764.20 figure.
Gold's Mid-Term Picture
Even with the last short-term correction phase with the 10-day cycle, the mid-term view has gold heading higher with the 72-day wave, which is shown again below:
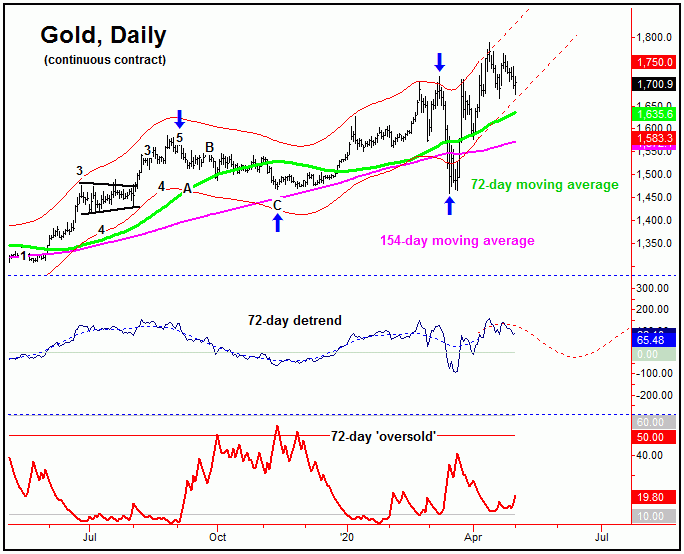
On the chart above we can see that the recent correction took gold back to the bottom of the (extrapolated) channel - and with that we have potential for a low in place, or else should bottom with any lower low in price. If correct, prices should soon turn higher again into mid-to-late May, before working on the next good swing top - which is expected to come from this 72-day component, with more precise details noted in our Gold Wave Trader market report.
Going further with the above, once the 72-day wave does top out, we expect our 72-day 'oversold' indicator to spike back above its upper reference line - something which was never seen at the March bottom, due to swiftness of that low. If it does materialize as expected, it will offer up what could be the final good buying opportunity for the metal - prior to a sharp multi-month rally in the months to follow, coming from our larger 310-day wave, shown below:
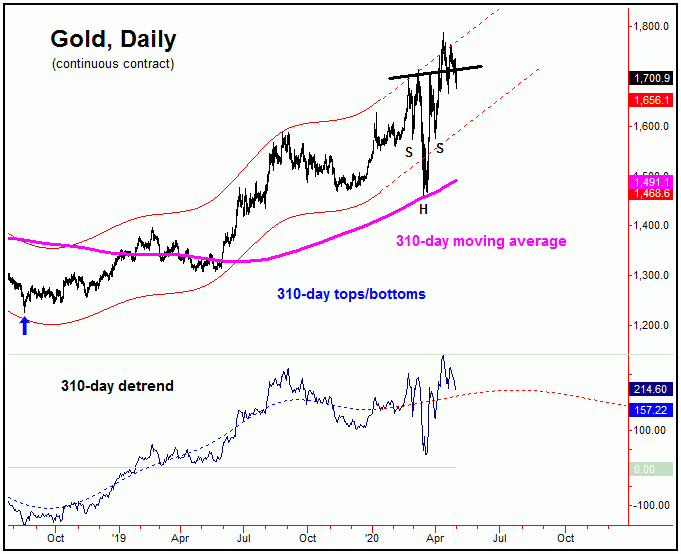
For the bigger picture, the 310-day cycle is pushing higher into what looks to be later this year - something which is also in line with the normal seasonal tendencies with the gold market. As mentioned many times in past months, the overall assumption is that a push up to the 2000 figure will eventually be seen going forward - something which has also been suggested by the inverse 'head & shoulder' pattern on the daily/weekly chart.
Once we do get into later this year - and if we are making the expected test of the 2000 level - then we will have to be on the lookout for technical indications of the next important peak - which is expected to come from the larger four-year wave, which is shown below:
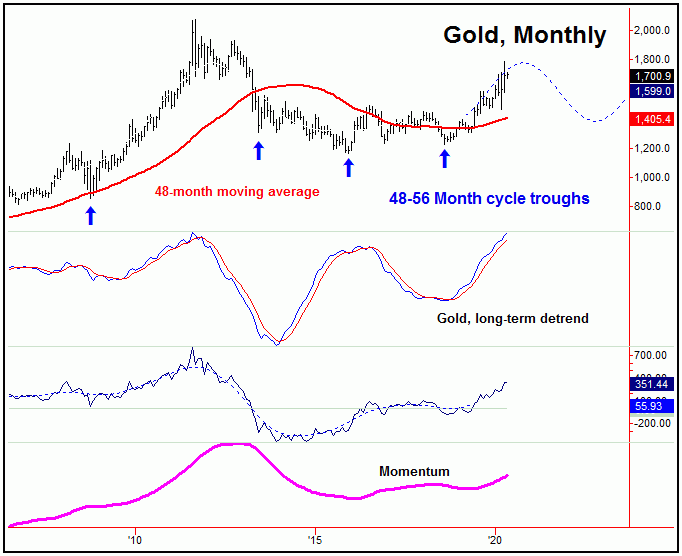
From whatever high that does form with the four-year wave, the odds will favor a sharp drop back to the 48-month moving average or lower in the months that follow. More on this as we continue to move forward.
Lastly this weekend, in terms of technical action, of honorable mention is that our Mid-Term Breadth index for gold has recently turned lower, and is shown again on the chart below:
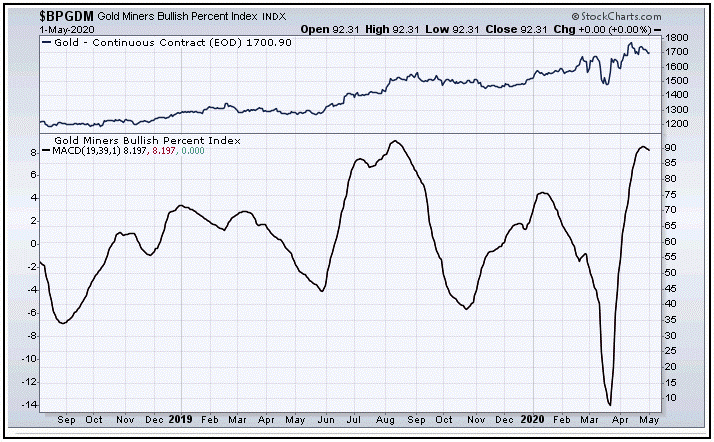
From the comments made in recent weeks, this indicator has an overall range of 0 to 100, and, with the recent turn south, it suggests that the remaining upside with the 72-day cycle should be fairly limited (low-1800's). Once again, the next really good buy should come from the bottom of that wave into June - again more exact details noted in our Gold Wave Trader market report.
U.S. Stocks Update
From the comments made in recent weeks, the U.S. stock market - as measured by the SPX (S&P 500 index) - was in rally mode, easily reaching our 35-day moving average target. Here again is our dominant 45-day wave:
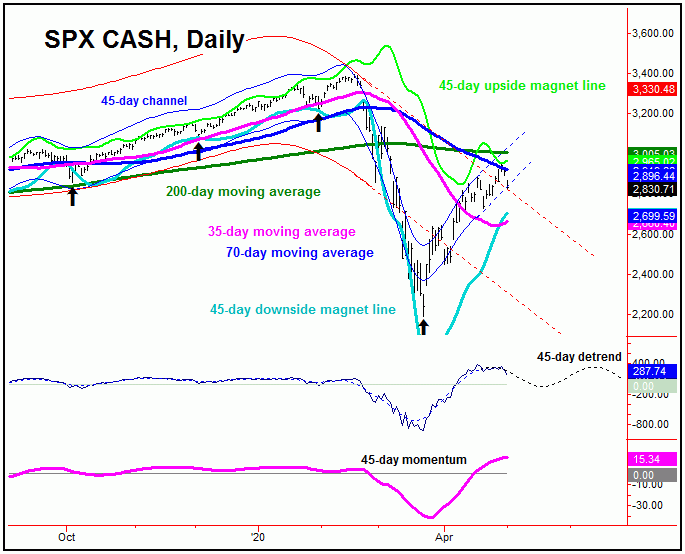
From last weekend: "the 35-day moving average was the 'magnet' to the upward phase of our 45-day cycle, though with the following analysis suggesting an upturn in our larger 90-day wave - which puts the 70-day moving average as the next expected magnet."
As mentioned above, the 70-day moving average was the expected upside magnet for price, with that key moving average also being at or near the 61% retracement of the swing down from the 3393.52 peak to the 2190.86 low. Thus, this area was the prime range for the recent rally to conclude - and with that the decline seen off this level into late last week came as no surprise. Here is our 90-day cycle:
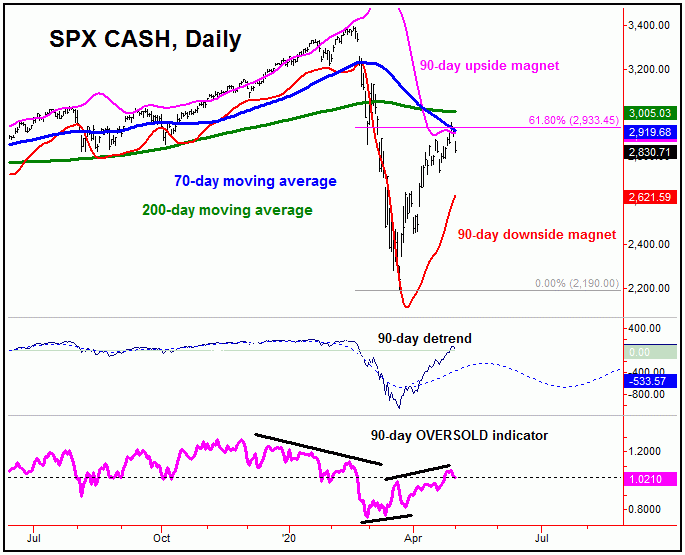
With the above said and noted, we can see our 90-day wave pointing higher into June, though with the smaller 45-day wave looking for a correction in-between. We could be in the midst of that correction already, though it has yet to actually be confirmed. Even said, a correction with the 45-day wave is expected to end up as countertrend - against the late-March lows - and with that should be favored to give way to strength again into June, before working on the next semi-important peak.
The Bottom Line
The overall bottom line is that gold is in a series of smaller-degree corrections in the days/weeks ahead, though each of these are expected to end up as countertrend - against the mid-March low. From there, we expect the final resolution being to the upside into later this year. As for the U.S. stock market, a decent correction should be seen with the 45-day cycle in the coming weeks, a move which is expected to end up as countertrend, giving way to another good rally into the month of June - before forming an important peak for stock prices. More on all as we continue to move forward.
Jim Curry
The Gold Wave Trader
http://goldwavetrader.com/
http://cyclewave.homestead.com/
More from Gold-Eagle


