Gold Cycles Moving Into Bottoming Territory
 share
share
 share
share
 share
share
 share
share
 share
share
 Recapping Last week
Last week's trading saw Gold forming its high in Monday's session, here doing so with the spike up to the 2003.00 figure. From there, a sharp decline was seen into later in the week, with the metal dropping all the way down to a Friday low of 1928.00 - before bouncing slightly into the daily/weekly close.
Gold Cycles, Short-Term
For the near-term picture, the downward phase of the 10 and 20-day cycles was confirmed to be in force early last week, which favored additional short-term weakness for the metal. With that, the next smaller-degree low is expected to come from these two waves, with the same moving into their early-end bottoming window.
Here is the smaller cycle, the 10-day component:
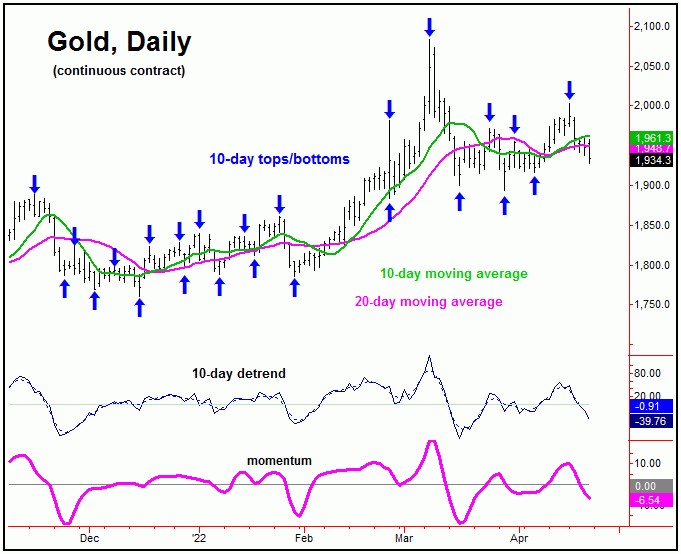
From my 3/27/22 article: "In terms of price, there is key resistance to the short-term upward phase at or into the 1986-2008 region for Gold, which is the 50-61% retracement zone of the move down from the 2078 swing top to the 1895 swing low. This same range is also near our upper 20-day cycle band (i.e., 1996 and declining), and - if tested in the days ahead - would be an ideal area to watch for the next countertrend peak to form."
As mentioned above, Gold had key resistance at the 50-61% retracement zone of the first swing down. This range did stop the move higher into early last week with the tag of the 2003.00 figure, a move which was anticipated to end up as countertrend - due to the position of the larger 72-day component (more on this in a bit).
In terms of time, the 10-day wave is now 11 trading days along, with the larger 20-day cycle being some 17 days along - thus putting each of these waves into bottoming area. Having said that, it is too early to confirm a trough with these cycles, though the next short-term upward phase - when back in force - would be favored to take Gold back up to the 10-day moving average or better, a normal minimum expectation.
Gold's Stepped-Back View
From the comments made in past articles, the last peak of significance came from the 72-day cycle for Gold, which is shown again on the chart below:
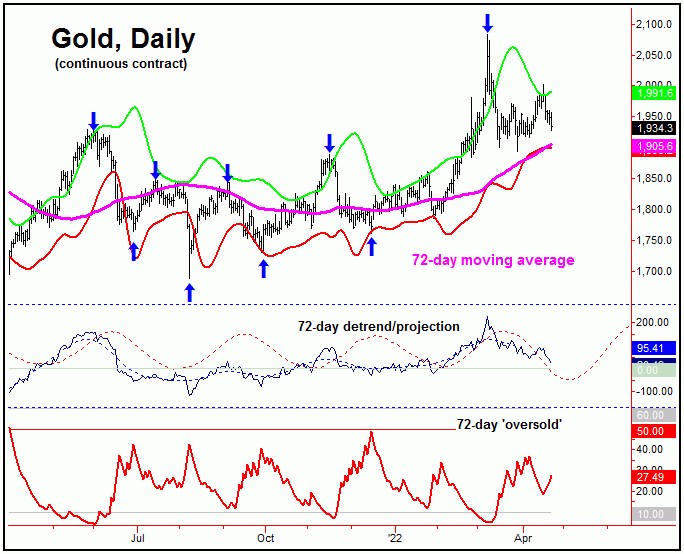
In terms of time, this 72-day cycle has been seen as pushing down into the mid-April region, but with a decent plus or minus variance in either direction. In terms of price, our favored path has been calling for a drop back to the 72-day moving average and/or the lower 72-day cycle band - something which has yet to materialize, though we are certainly inching closer to the same with the recent action.
With that, the best 'look' would be for additional weakness to be seen in the coming days, with the aforementioned price zone (i.e., low-1900's) acting as the magnet. In-between, there may - or may not - be a bounce with the smaller 10 and 20-day cycles. In fact, the best 'look' would be for the metal to go ahead and drop on down to the 72-day moving average or lower.
As mentioned in prior articles, in order to set up the next good buy signal for Gold, I would like to see our 72-day 'oversold' indicator spiking above its upper reference line, in addition to a daily close below our lower 72-day cycle band. Ideally, I would like to see both of these occurring on the same trading day.
Going further, I would also like to see Gold sentiment becoming more bearish in the days/weeks ahead. With that, the chart below shows our sentiment index for Gold:
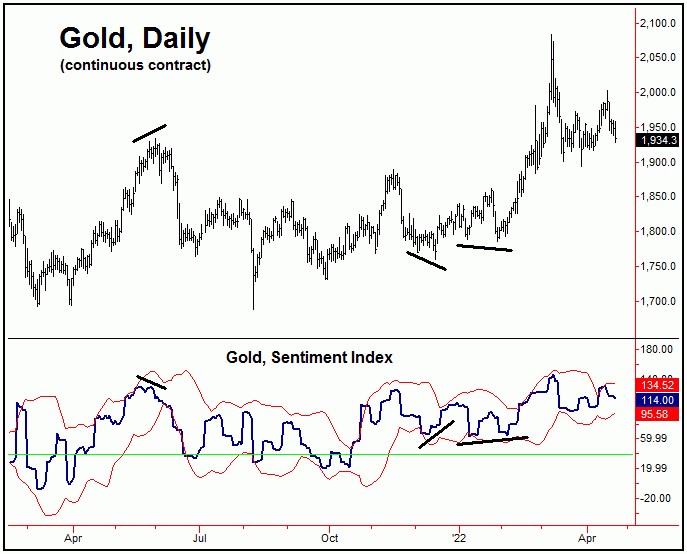
The action of Gold sentiment has been bothersome in recent weeks, with this indicator remaining high - in spite of the overall price decline. With that, though I will still be looking for indications to buy the next 72-day trough, I would certainly want to keep any bets fairly small - at least until some change in sentiment is seen.
Stepping back, until proven otherwise, the favored path is for the current downward phase of the 72-day cycle to end up as a countertrend affair, holding above the mid-December, 2021 and January, 2022 price bottoms. If correct, the probabilities will favor a sharp rally playing out mid-to-late Summer, before topping our larger 310-day component, for the next mid-term correction phase in Gold. Stay tuned.
Jim Curry
The Gold Wave Trader
http://goldwavetrader.com/
http://cyclewave.homestead.com/
*********
share
share
share
share
share


