Gold Data Science


The physical gold demand from key consuming nations such as India and China has been strong lately, although Indian demand may wane, according to Commerzbank.
Analysts cited a data from the Census and Statistics Department of Hong Kong showing that China imported 74.2 tons of gold from Hong Kong on a net basis in April. Although this was less than in the previous month, it was 8% up year-on-year.
India also imported a large amount of gold last month – namely 94 tons, according to figures from the Indian central bank. A good half of this total came from Switzerland. Thus physical gold demand in the core demand countries has remained very robust of late.
Nonetheless, there are growing doubts on the market that India will maintain this high import level throughout the year. Analysts noted that both the World Gold Council and Thomson Reuters GFMS believe that gold demand there could slow in the second half of the year – normally a period of high demand – because a goods and services tax is to be introduced in India on 1 July.
Jewelry retailers may well continue to build up their stocks of gold until that point, however, Commerzbank added.
GFMS therefore expects to see relatively high gold imports (450 tons) in the first half year, followed by relatively low imports (250 tons) in the second half. Predicting imports of only around 525 tons for the year as a whole, the WGC is taking a considerably more pessimistic view.
The price of gold went up $12 this week, and that of silver $0.50. That’s not bad for gold and silver owners, and not good for the vast majority who are all-in on the dollar (though they don’t think of it that way).
Since we began publishing this Supply and Demand Report four and a half years ago, there have been several constants. One, we have focused on the supply and demand fundamentals, and the mechanics of the market.
Two, we have tried to show that short-term price moves are usually random. For example, we have documented many spike ups followed by let-downs whenever the Fed Chairman went on TV. And we all know that the long-term price trend is up (the mirror of the falling dollar). However, neither random short-term bursts nor the long-term trend is actionable for trading. In between, there is the fundamental which tends to pull the market price either up or down, depending on market conditions.
Three, there is no gain when the gold price goes up. This is because gold is not going anywhere. If you bought 100oz of gold 20 years ago, then you still have 100oz of gold now (minus storage costs). Sure, it’s worth more dollars but those dollars are worth proportionally less (and if you sell, the tax man will take a big chunk).
This may seem like mere semantics, but it’s an important principle. It’s the dollar which is volatile. And its gyrations can only get worse.
Therefore, wealth should be measured in gold ounces or grams. We recommend you periodically take the dollar value of your assets, and divide it by the current price of gold. If the dollar value goes up, but the gold value is down, which are you going to believe? One is the numeraire extraordinaire that man has valued for thousands of years, and the other is the elastic dollar managed by a central bank whose stated policy is devaluation at two percent per annum (a target they cannot accurately hit).
You can make gains in gold if you bet successfully on the price moves in both directions. If you buy when the price is lower and sell when it’s higher, you will end up with more gold. The trick is to make sure you buy the gold again, otherwise you will have given up your gold and got only paper in exchange.
And you can make gains in silver, as silver goes up and down as measured in gold terms. Most people call this the gold-silver ratio.
Four, we have included charts generated from software developed by Keith. The data was the highest quality possible in that environment, and the best available.
The first three will remain the same, but number four is changing. We are now launching a software platform that is the culmination of Keith’s development of the arbitrage theory of markets since 2010, his model of the gold market, and four generations of software (two by him, and two by our VP of Software, Rudy Mathieu).
We had to solve some Big Data problems, as we licensed 21 years of tick history data from Thomson Reuters. It is over 2 terabytes—big enough that you can’t handle it with a conventional database. We had to solve some Data Science problems too. Data from the real world is messy (and in some historical time periods, incomplete).
We believe we now have the cleanest data, and hence the best signal, bar none. Our software platform makes it possible for us to see the full breadth of the market dynamics and to drill deep as well. We will be showing many new graphs, including the Gold Forward rate (GOFO) with both bid and offer.
In this Report, we include the new graphs, generated by the new software. You will notice that we show the bid prices of the metals. There is no such thing as a single price (except in the case of a fix, like the gold fix). There are always two prices in a live market. We believe that the bid is a better measurement of what a thing is worth. It is the price you would be paid, if you sold it.
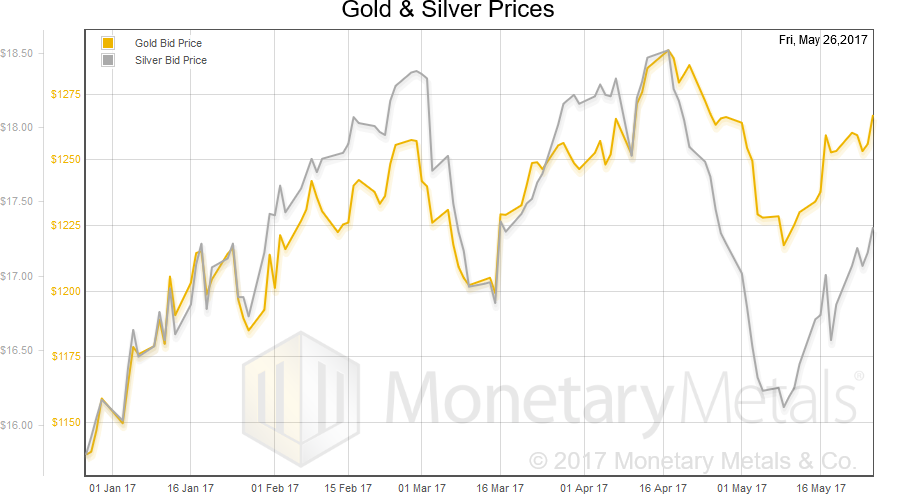
Click here for 3 year and 21 year versions of the chart above.
Next, this is a graph of the gold price measured in silver, otherwise known as the gold to silver ratio. It moved down 1.5 points this week.
In this graph, we show both bid and offer prices. If you were to sell gold on the bid and buy silver at the ask, that is the lower bid price. Conversely, if you sold silver on the bid and bought gold at the offer, that is the higher offer price.
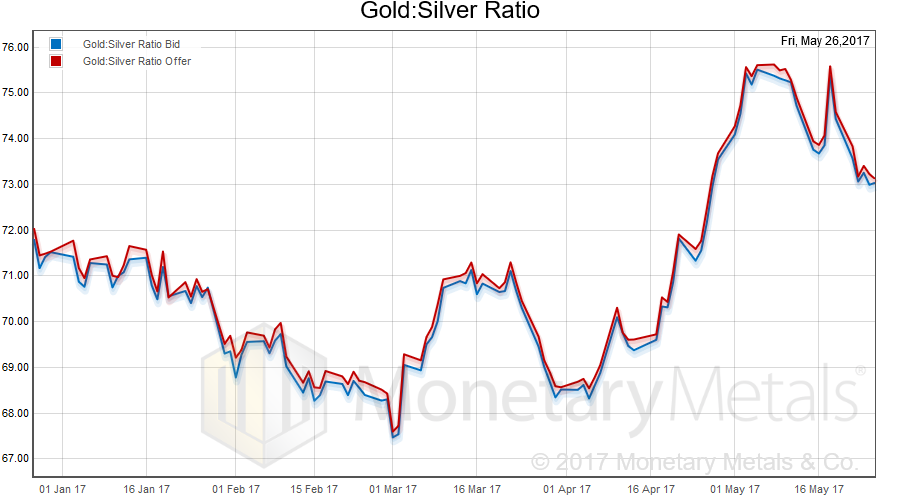
Click here for 3 year and 21 year versions of the chart above.
For each metal, we will look at a graph of the basis and cobasis overlaid with the price of the dollar in terms of the respective metal. It will make it easier to provide brief commentary. The dollar will be represented in green, the basis in blue and cobasis in red.
Here is the gold graph.
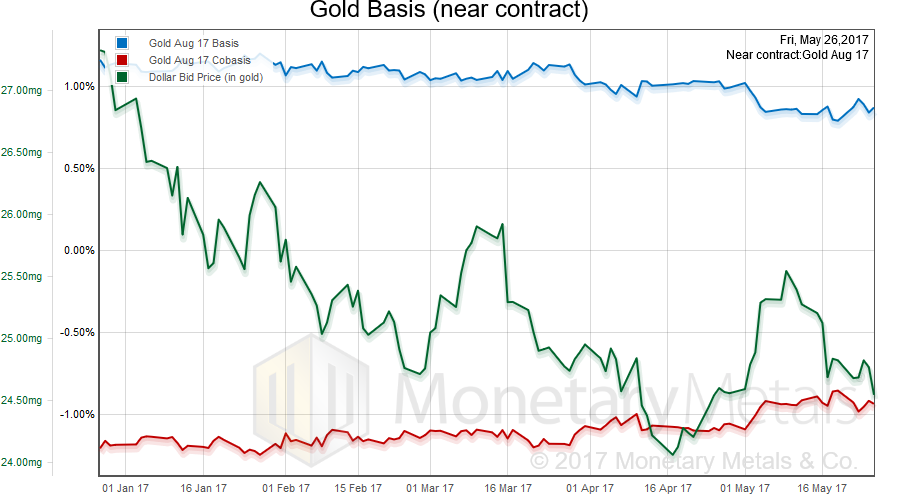
Click here for 3 year and 21 year versions of the chart above.
The bid price of the dollar is calculated from the offer price on gold (as buying gold is just selling the dollar).
We see a small rise in the basis (i.e. abundance) and drop in cobasis (i.e. scarcity), while the dollar dropped 2mg (i.e. the price of gold went up).
Our calculated fundamental price fell a few dollars (you can view the chart here) although our new software platform calculates a higher value than the old. It’s important to look at why.
The reason is on this graph of the continuous basis both from the old software (with the old data provider) as well as the new.
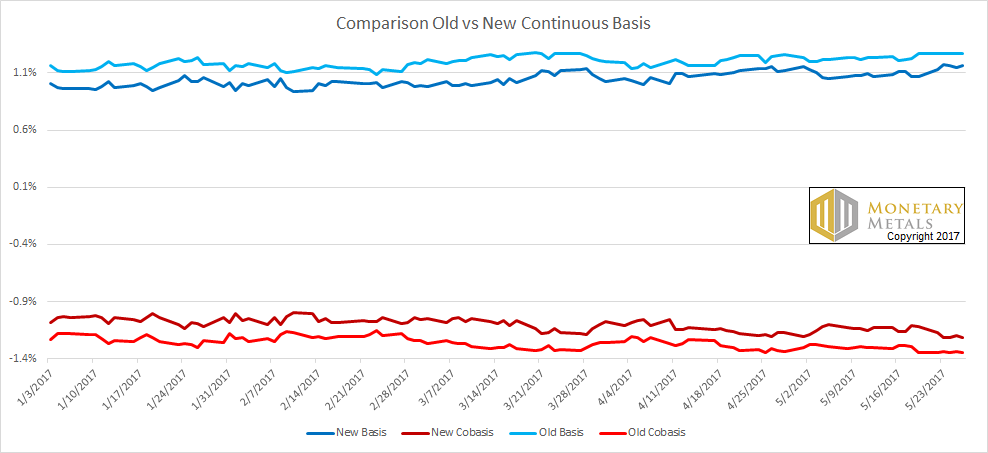
The new basis (abundance) is a bit lower and the new cobasis (scarcity) is a bit higher, compared to the old. That’s why our calculated fundamental price is higher.
Which is more accurate? While we still have more work to do validate the new, we would bet an ounce of fine gold against a soggy dollar bill that the new values are more accurate for two reasons. One, the raw data is better. Two, the new software is better. Is it possible there is a bug? Of course, but we would not expect a bug to result in a tighter spread.
The absolute value of the fundamental prices of the old and new software/data are different. However, the direction (and approximate size) of the move this week is the same.
Now let’s look at silver.
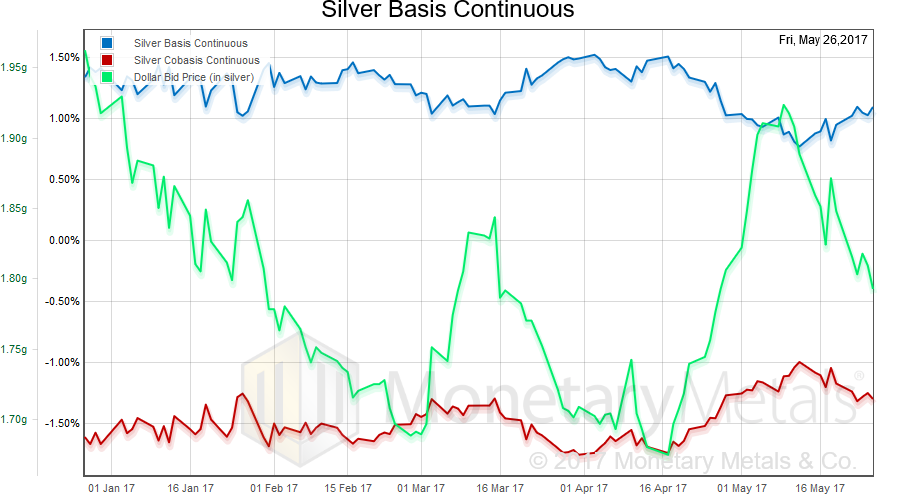
Click here for 3 year and 21 year versions of the chart above.
In silver, there is almost no change in the July basis or cobasis.
However, the market price is up. And so it’s not surprising that our calculated fundamental price is up as well (both old and new).
Here is the corresponding graph comparing the old and new continuous silver bases.
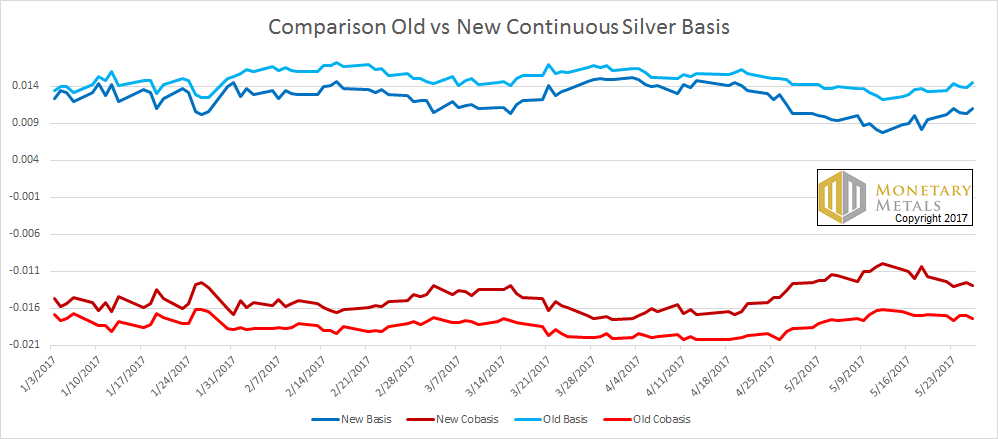
The difference is even more pronounced in silver. Whereas in gold, the basis came down 10bps and the cobasis up 13bps (on May 26). In silver, the basis came down 34bps and the cobasis up 45bps. The cobasis is now much closer to a mirror image of the basis. It will never be perfect, which is just how the math works out.
Recall that basis = future(bid) – spot(ask), and cobasis = spot(bid) – future(ask). If there is a bid-ask spread (and there is), then the cobasis will be more negative than the basis is positive. On Friday, the old basis and cobasis are 1.44% and -1.74%, respectively. The new are 1.10% and 1.30%, which are closer both in absolute and percentage terms.
What is the new silver fundamental saying? Well, remember that technical analyst we’ve been writing about since the beginning of May? Well let’s just say that the new silver fundamental calculation definitely does not suggest that one ought to have shorted silver or ought to be shorting it now.
Keith will be speaking at the Mining Investment Europe event in Frankfurt in mid-June. He will be in London the week of June 19, and in New York the week of June 26. If you’re interested in attending a Monetary Metals seminar on GOFO and transparency in the gold market in either city, or to meet with Keith to discuss gold investment, please click here.
© 2017 Monetary Metals
 Dr. Keith Weiner is the CEO of Monetary Metals and the president of the Gold Standard Institute USA. Keith is a leading authority in the areas of gold, money, and credit and has made important contributions to the development of trading techniques founded upon the analysis of bid-ask spreads. Keith is a sought after speaker and regularly writes on economics. He is an Objectivist, and has his PhD from the New Austrian School of Economics. His website is www.monetary-metals.com.


