Gold & Dow Jones Step Sum Symmetry


Here is a chart I've never before published. It's a Step-Sum Symmetry Chart with a gold bias. What in the heck is that? Well, as we all know, during bull or bear markets there are about as many up days as there are down days. BUT, over the long term, bull markets see slightly more up days than down days, as bear markets see slightly more down days than up days. Being biased for gold means the plot in the chart below follows bull and bear markets for gold.
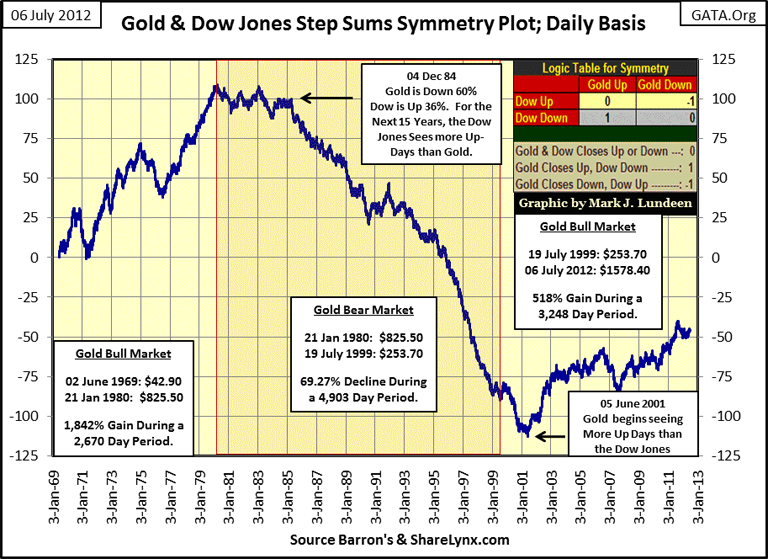
In this symmetry chart above, we are comparing the daily up and down steps for the closing prices of both gold and the Dow Jones, two assets that are historically countercyclical to each other. It's not hard to understand what moves the plot up or down over time, if you understand the logic table located on the chart's upper right hand. On any day when both the Dow Jones * AND * the price of gold go up * OR * both go down together, their symmetry is equal to zero, and zero has no effect on the plot. So, if gold and the Dow Jones had closed up and down together, every day since January 1969, the plot would have flat-lined at Zero for the past forty three years.
But, though gold and the Dow Jones do on a daily basis usually go up and down together, what the above step-sum symmetry seeks to uncover is whether gold or the Dow Jones is seeing more up days than the other over time. The signal we are looking for is very small.
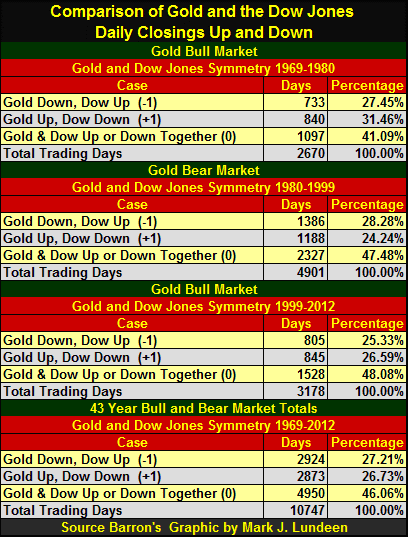
Here is a table that gives the daily breakdown for daily steps used in the symmetry plot above. Go down to the bottom of the table to the 43 year Bull and Bear Market Total. Notice that the price of gold and the Dow Jones have closed together (up and down) for 46% of the total trading days since 1969. Also notice that during our two gold bull markets (1969-80 & 1999-2012), gold sees more up days than does the Dow Jones, but not many more. During the 1980-99 gold bear market, the same period of time that the Dow Jones saw a massive bull market, the Dow Jones saw 198 more up days than did gold. The signal seen in the step sum data may be small, as we can see in the table below, but it's compelling as we can see in the chart above.
As I previously mentioned, this symmetry plot is biased for the price of gold. Should the price of gold go up, and the Dow Jones goes down, the daily symmetry is equal to +1. Should the price of the Dow Jones go up, as the price of gold declines, the daily symmetry is equal to -1. But remember, most days the logic of this symmetry produces a zero value, with an occasional +/- 1 during a ten day period.
Let's return to the chart. So exactly what are we looking with a step-sum symmetry plot? Variations in bull and bear market sentiment in the gold and stock markets, displayed by the net number of up and down days between gold and the Dow Jones. Take for example the 1969-80 gold bull market in the chart above. From 1969 to the top of the gold bull market in January 1980, gold saw 107 more up days than did the Dow Jones. A net of 107 more up days for gold over the Dow Jones may not seem significant over an eleven year period that took gold up 1,842%, but the market doesn't care what you or I think of how it gets from point A to point B. I just do the math, and accept what it tells me if its conclusions support market reality.
Take a look at the symmetry plot from January 1980 to December 1984, a four year period where almost every day that saw a +1, (gold up, Dow down) was followed by a -1 (gold down, Dow up), meaning that both gold bugs, and stock investors in the Dow Jones were very bullish. But look at text box provided in the chart; from 1980-1984, the price of gold was down 60% while the Dow Jones gained 36%. Beginning in early 1985, the gold bulls finally got the message from Mr Bear that gold was in a major bear market. In the period from 1985 to 2001, gold saw 210 more down days than the Dow Jones. Again, 210 net down days for gold when compared to the Dow Jones doesn't seem like much over a sixteen year period. But these 210 days occurred during a period when gold was declining 70% while the Dow Jones was enjoying a historic bull market. We shouldn't be surprised at this, since over the long term, gold and the stock market have always been countercyclical to each other. Even during the 19th century, the smart guys on Wall Street, like Jay Gould or Cornelius Vanderbilt, knew when to sell their stocks, and use the proceeds to buy gold.
Of interest to gold investors, and to anyone who is thinking of buying gold and silver, in June 2001, the symmetry plot reversed for the second time since 1969, with gold now seeing more net up days than the Dow Jones. Is it merely a coincidence that since the 2001 reversal in the "Gold - Dow Jones Step-Sum Symmetry Plot" gold has gained an impressive 518%; as the Dow Jones has experienced two massive bear market bottoms, and now struggles to exceed its 2007 highs? After looking at data spanning forty three years, I don't think so. This step-sum symmetry plot is just one more reason to have faith that the current (2001) gold bull market has a long way to go, and the weakness plaguing the stock market since 2001 will continue for as long as the Gold & Dow Jones Step-Sum Symmetry plot continues to climb.
* Market Update *
Today's decline in gold and silver was disheartening, but the current corrections seem stale. In other words, I believe that in both time and percentage declines, we are much closer to the end than to the beginning of our current corrections for the old monetary metals. How many days we bulls still have to wait I haven't a clue, but I expect that anyone who purchases gold and silver today will be glad they did by Christmas.
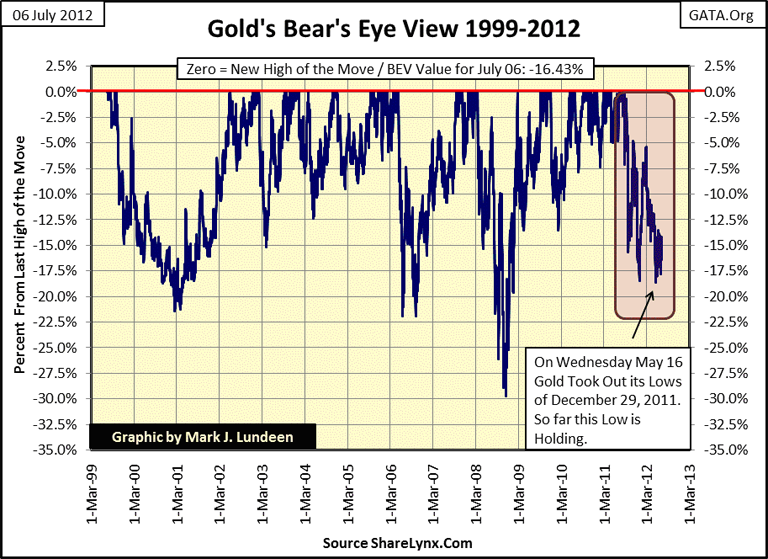
Here's what I'm looking at: Since 1999, gold has seen four corrections deeper than 15%, and the correction that began last Aug 23 (our current correction) has been the shallowest of the four corrections of the past thirteen years. The bears have yet to break gold down 20% from its last all-time highs of last August. You do realize that they are still trying, don't you? Well of course they are, and so far the best they could do was a -18.66% decline on May 16th. Every significant move in the market ends in a climax. Right now we need to wait to see if the current 18.66% bottom of this current decline holds, thus marking the bottom of the correction that began last August. Little things like this matter in the markets.
The following is really strange for most people to understand, but it's a shame that it is. Last December's decline resulted in almost panic conditions in the gold market as CNBC's "experts" in the gold market (and to anyone who could add and subtract), could see that the price of gold saw its largest dollar decline in history. That's a scary thought! But this "biggest decline in the history of the gold market" only proved that the current US dollar is a flawed unit of account.
From last August's new all-time highs to the lows of December, gold saw its largest dollar decline in the history of the gold market: $348. I can't argue with that! But realize that, at the bottom of the 2001 correction shown above, gold was selling for $255 an ounce, after falling 21% from $324, a price that was less than the entire December 2012decline! The fact that this big 21% decline in the price of gold resulted from a dollar decline of only $69 tells us how far this bull market has taken the price of gold; all the way up to $1888 last August. When viewed in percentage terms, (the only proper way of viewing these things), we see the impact of a market movement on our portfolios in its trueperspective.
So forget dollars, think in percentage terms, which is exactly what my BEV charts do. What the 18% decline (the shallowest percentage decline of the last four) in the BEV chart above tells me is that the suppression efforts of the "policy makers" are getting weaker with each passing day. Heck, how did they allow gold to rise so high that a $324 decline only resulted in a 18% decline?
Let's look at gold's step sum. Remembering that the step sum is a measurement of market sentiment, we see that since gold's last all-time highs of August 2011, market sentiment has remained stubbornly neutral, except when it collapsed at the end of a bear box or afterwards when it was rebounding back to neutral on a rise in gold. Well, since last August, what has the price of gold done to get the bulls excited? Ten months of nothing! Ten months of stubborn bullishness as the price of gold corrected 18% is not really bullish. Remember, the step sum's trend tells us what the bulls and bears expect from the market, but the price trend tells us what the market is willing to deliver!
I'd like to see the step sum collapse here, indicating that the gold bulls had given up hope in the price of gold rebounding. But if gold bugs are anything, they are stubborn!
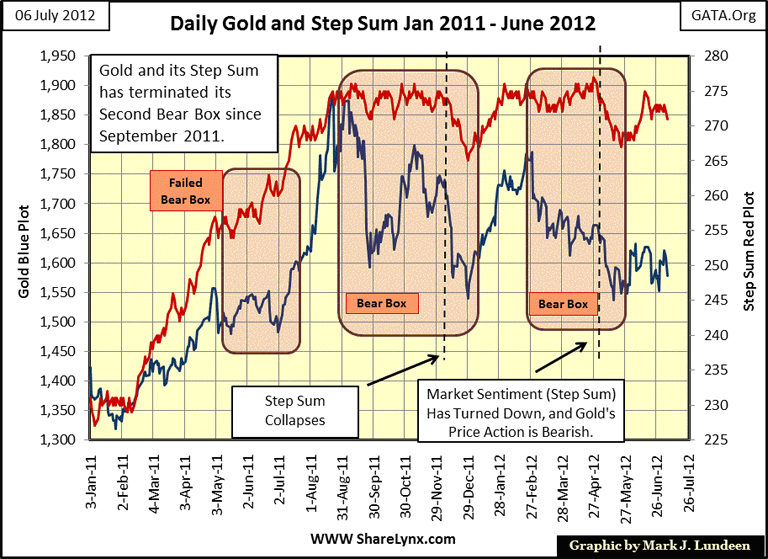
Lucky for us, this step sum chart will also tell us when the price of gold finds it mojo again: when both the price of goldand its step sum again decisively turn upwards. Until that happens, we may discover that we have not yet seen the final low in gold's current correction. Go back to gold's BEV chart above. My gut feelings are that if the best the bears could do was only an 18% decline from last August's highs, the next advance could be explosive! The current UK investigation into LIBOR rate manipulation by the big banks is a positive factor for the gold bulls, as these banks are also the same ones manipulating gold and silver prices below their free market values in the paper futures markets. So, at risk of sounding repetitive, I can't say whether the final lows of this correction are in, but step sum breakdown ornot, I'm leaning that way more and more each day, even after a bad day like today.
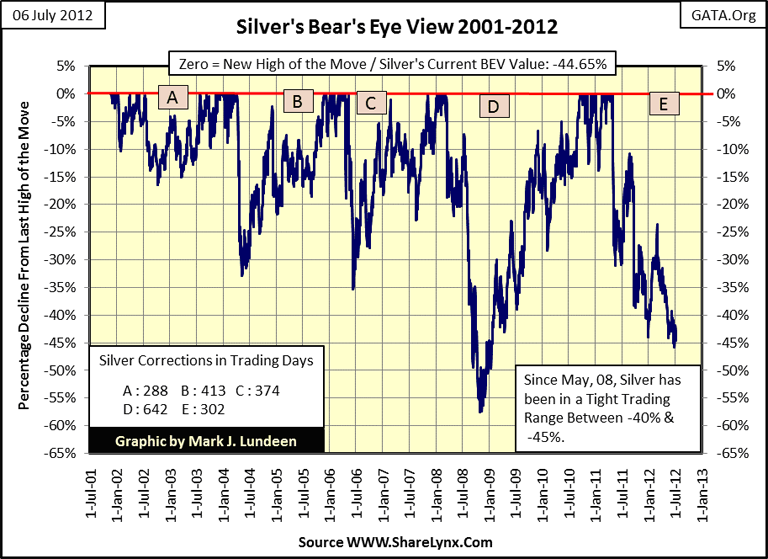
Let's look at silver. Silver, unlike gold, really got knocked around since its last high of the move in April 2011. It now finds itself at the bottom of its second deepest correction since 2001, but this is obviously pure market manipulation by the nameless, faceless "policy makers." But since May 8th (two months now), silver has been in a trading range between BEV -40% & -45%. To me, that seems like a long time for silver to be doing not much of anything during a BIG 45% correction, unless our correction is pretty much over. No guarantees here, bad things could come, but wemay just have found the ultimate bottom in our Letter E correction.
Silver's step sum is getting very interesting; it just continues to grind down even after its bear box terminating collapse in May, as the price of silver refuses to break down to new correction lows. Its forming a bull box - "forming" is the operative word here as I don't take contrary trends in the price and step sum all that seriously until they continue for at least two months. But this has been going on now for a month and a half now, nearly two months. This is a very bullish development, seeing market sentiment (the step sum) decline as the price trend refuses to follow. But then, theoretically, the price of silver could also break down! So, as always, we have to wait to see what the price of silver does in the weeks and months to come. But using step sum analysis, the current price of silver looks very attractive.
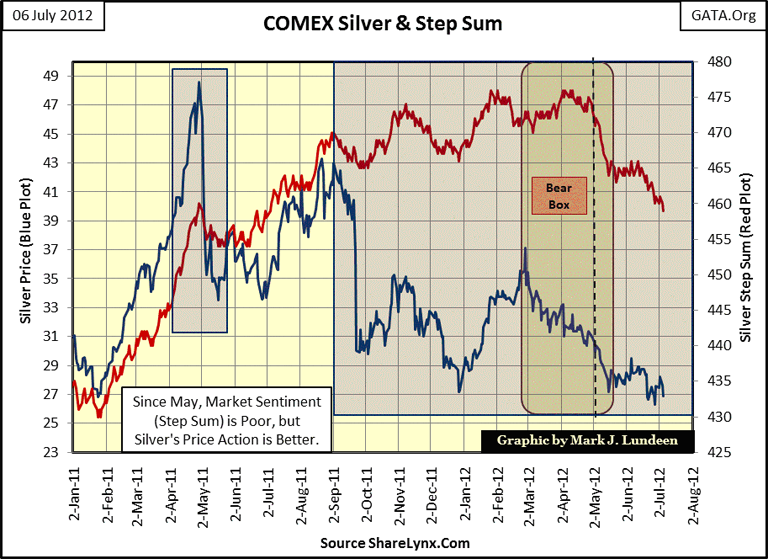
What is a step sum? The step sum is a single item A-D line for whatever price series to which it's applied. In the above chart, every time silver sees an up-day, its step sum goes up +1; when silver sees a down-day, its step sum goes down -1. I then take the sum of all the +/- 1's to derive the price trend's step sum. It's amazing to see what a price and its step sum trends do over time. Look at the big blue box I placed over the chart spanning the last ten months. From last September up to the step sum's collapse in the bear box (vertical-dashed line that terminated the box), you can feel the stubborn bullishness of the silver bulls as the price of silver collapsed down in a 45% price correction. I could actually have begun silver's Bear Box way back last September, instead of this March.
So what should we make of this? I think silver really is forming a Bull Box, where market sentiment, as measured by silver's step sum, will continue to decline as the price of silver begins to climb out of the hole in which it now finds itself. And there is nothing more bullish in step-sum analysis than seeing so much hope for higher prices being dashed by price reality, only to see market sentiment continue going down as the price trend reverses upward. Too early to call a Bull Box for silver just yet, but it's certainly looking that way.
Let's look at the Dow Jones' Bear's Eye View chart. Superficially, the Dow Jones is looking better than gold and silver. Unlike gold or silver, the Dow Jones is now only 9.83% from making a new all-time high. Heck, silver is down 45%! But this is deceiving, as the Dow Jones has yet to see a new all-time high since October 2007, while gold and silver, (even at their current depressed prices) are now 107% and 96% * ABOVE * their October 2007 prices!
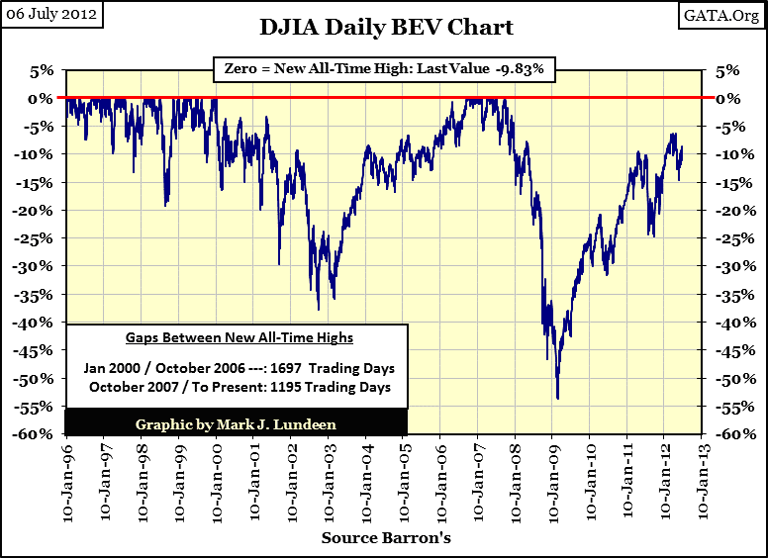
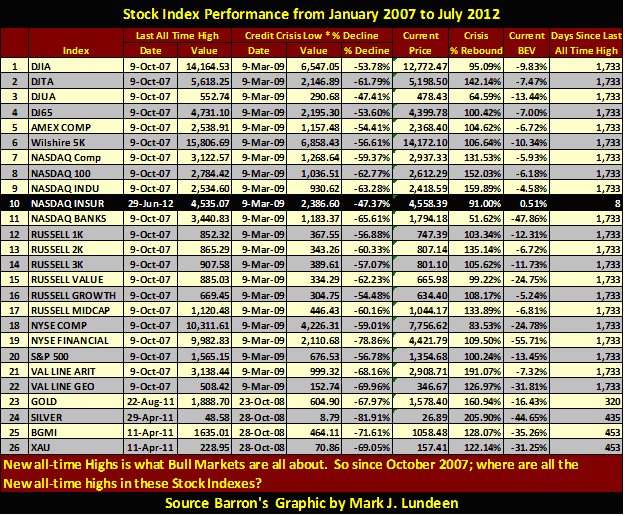
This is true for most of the stock market indexes. After a five year wait, they have yet to exceed their last all-time high prices from 2007. The table below lists the details. One thing to note about the "days since last all-time high" column in the table below; they are calendar days that include weekends and holidays. The days in the chart above are NYSE trading days. I decided to use calendar years in the table below to illustrate how stock market investors are getting old and grey waiting for the glory days of the 1982-2007 bull market to return.
These indexes may all go on to new all-time highs in the next year, but then maybe they won't. Personally, I think of the stock market as just another bad habit that will do investors little good for a long time to come. Other than the NASDAQ Insurance index (#10), none of these indexes have made a new all-time high since 2007. Yeah sure, most look as if they are about to go on to new all-time highs, but like the Dow Jones, they've looked that way for over a year. What are they waiting for?
For good reason, people date the beginning of our "current bull market" to August 1982. That is thirty years ago, one heck of a long time for a stock and bond bull market; in fact too long if the financial markets were left to their own devices! So it's no surprise that in 2012, grand-pa Dow Jones tires easily and then needs to take a break after just a little excitement.
Look at all the positive NYSE 52Wk H-L days since the first of June; (table below) nineteen of them. I'd have thoughtwith a tailwind like this the Dow Jones would've cleared 13K by now with so many stocks making new 52Wk highs since June 1st, but so far it hasn't. And then Friday we saw a 124 point drop in the Dow as the NYSE 52Wk H-L ratio saw a net of 160 new NYSE 52Wk Highs. It really is time for someone to put that poor bull out of its misery. But every time Mr Bear begins cleaning up the garbage left behind by the bulls, he gets a fire hose of "liquidity" pointed his direction!
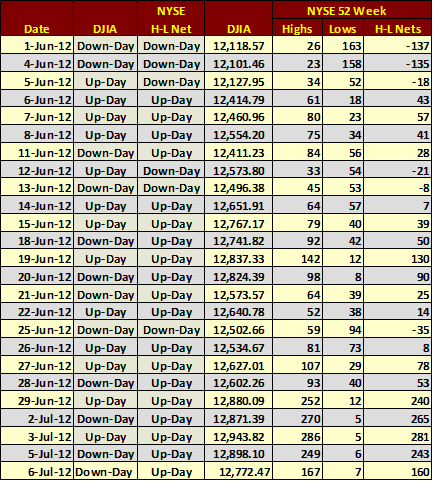
And the NYSE's 52Wk H-L ratio just ain't what it used to be either. Since April of 2011 (wave #2) it hasn't had a positive 10% day. So what's wrong with the stock market? The market's enthusiasm, so clearly visible in Wave #1&2 the chart below, is now gone.
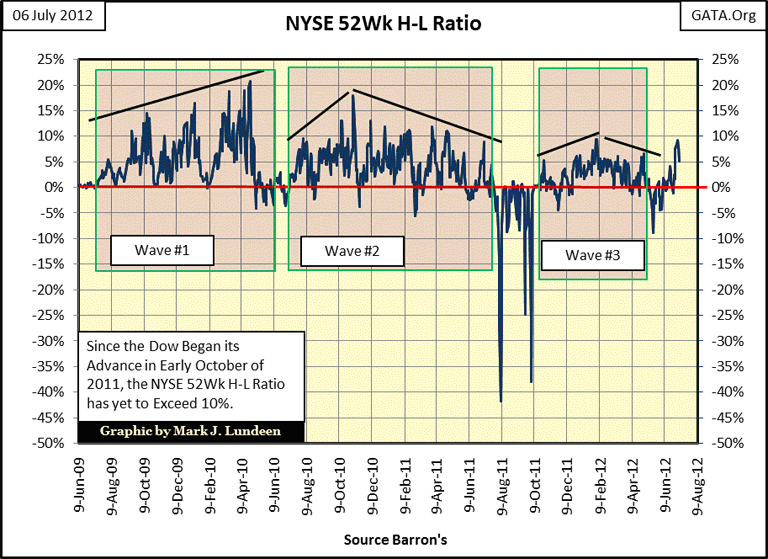
What this lack luster action in the NYSE 52Wk highs is telling us is that three years after the March 2009 credit crisis bottom, the stock market is due for a significant price correction. How significant? I think the next correction will test, and possibly exceed the lows of March 2009. But every time the stock market has a bad day, like today, CNBC spends much time telling us that Doctor Bernanke, against his will, is almost ready to break out his big monetary syringe and "inject liquidity" into the market. Should the Dow Jones break below 10,000, we can be sure that the good doctor will bend the stock market over his knee, and use an enema-bag to "inject liquidity" if that is what is required to get the Dow Jones back above 10,000!
But ultimately the doctor will fail, and Mr Bear's day will come. I expect the big furry fellow will succeed in breaking the stock market down below its March 2009 lows, as the global financial sector is currently gagging on trillions of dollars, euros and yen worth of insolvent debt from past "liquidly injections" (credit expansions) from the Fed and all the other central banks. Actually, it's this ocean of putrid, illiquid debt that will be ground zero for Mr Bear's cleanup crew. The stock market will only be a side show for what is coming our way, but an important sideshow to everyone who only did what they were told to do; invest in the stock market to fund their retirements.
Here are some words of advice my father gave me long ago: "pay your taxes, work hard at what you are told to do; and you'll get screwed every time." So don't get screwed, sell your stocks and bonds at their current artificially high prices, and buy gold and silver while their prices are still depressed by the "policy makers."
Mark J. Lundeen
[email protected]
[email protected]
More from Gold-Eagle


