Gold Due for a Breakout


The gold market has just completed the trough phase of its latest cycle and is due for a rise in the coming days, based on our cycle analysis. Since recovering from its post-Y2K depression, during which time many investors dumped their physical holdings of bullion due to the non-event of Y2K, the yellow metal has recovered some of its lost ground and is firming up prior to the dynamic phase of the short cycle. The gold chart exhibits the rounding-bottom look characteristic of a commodity that is completing the trough of its cycle and is being accumulated by insiders in anticipation of an upward move.
On a short-term basis, there are two predominant cycles that must be examined when analyzing the gold market-the 23-day cycle and the 12-day cycle. The latter in recent months has bottomed like clock work every time and has proven to be a very reliable indicator for gold price movement on a very short-term basis. The 23-day cycle is more subject to fluctuation and can often extend by a few days due to the cumulative effect of multiple cycles that may be bottoming or topping at the same time. Right now, it is evident that the 12-day gold cycle bottomed on Jan. 10 at the $282 level and now gold should have the benefit of upward momentum in the days immediately ahead. The 23-day cycle, meanwhile, is expected to bottom on Jan. 21, which is exactly the time-frame we expect the U.S. stock market to top during the course of its 24-day cycle. Thus, the last week of January should be a propitious time for gold bulls and stock bears, but only on an immediate-term basis.
The bullish nature of the cycle is perhaps best illustrated in the daily bar chart for COMEX gold futures. The 30-day moving average, which is the one most suited for gold's short-term cycles, has achieved a near-perfect equilibrium with the price line, highlighting the fact that volatility is very low. It is precisely such times of extremely low volatility as this that typically precede substantial breakouts in one direction or the other. And our analysis points to an upside breakout.
Providing further evidence for our assertion that gold is due a rise has been the impressive performance in recent days of most other major commodity sectors, including the grains, oil and interest rates. The grains market, alone, gives us great hope that gold could travel higher by several dollars in the days ahead. Witness the impressive breakout by CBOT wheat, corn and soybeans last week, as well as the bullish behavior of the leading wheat processing and fertilizer stocks. These securities are highly inflationary-sensitive and are excellent leading indicators for activity in other sectors of the market, including the gold market. And based on the recent uptick in such inflation-sensitive barometers as crude oil, interest rates and grains, it appears that a short-term inflationary cycle is in force. (However, this does nothing to negate the predominant deflationary cycle still in force at this time).
Our technical indicators confirm our forecast for gold. The 10-day and 30-day momentum indicators for gold are both hovering near the equilibrium, or "zero," line and are exhibiting a distinct upward bias. Thus, we surmise momentum is presently on gold's side. Volume momentum is also forecasting a rise to higher levels in the near future since it is currently in the dynamic phase of the upward-cycle.
The chart showing gold's On Balance Volume (OBV) has traced out a clear-cut "falling wedge" pattern, almost identical to the one in the chart for gold itself. This pattern almost always forecasts an upward bounce in price. When such patterns appear in indicator charts, it carries even more significance.
Our favorite chart and the one we believe to be most instructive is the one showing Mid-Range Volume (MRV). This indicator is constructed by counting all trading volume as either upside volume or downside volume depending on the relation of the closing tick to the daily trading range. If, for example, gold's price closed above the mid-point of the day's trading range, the volume for that day would be considered to be upside volume, and vice-versa. Admittedly, this indicator makes a broad assumption, but one more acceptable than OBV makes. MRV, which had been falling precipitously in recent months, now appears to have bottomed out on at least a short-term basis, and has formed a distinct "bowl" pattern, which forecasts higher prices ahead for gold. Thus, trading volume should be mostly upside volume for gold over the next few days-to-weeks.
In fact, our single biggest clue that gold is about to breakout to higher levels lies in the actual trading volume for COMEX gold futures. Notice how it has practically dried up over the past couple of weeks to almost nothing. Since this has occurred as gold was making a bottom, we make the (safe) assumption that gold's next move will therefore be higher. Indeed, trading volume has already started to pick up on upside closings in gold futures over the past couple of days. So expect a forceful move within a few days.
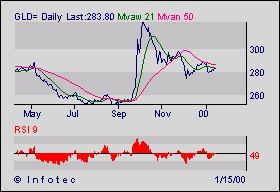
Relative Strength (RSI) for gold is bullish. The chart showing RSI is coiling into the apex of a very large and distinct triangle-type pattern. This is forecasting a nice move to higher prices. In short, all indicators are pointing toward higher prices in the gold market in the very near future.
Yet another reflection of the predominant upward mode of the gold cycle is the chart formation that can be seen in the XAU. The pattern is in the rounding bottom class, which portends more upside movement in the near future.

Since the expected breakout may not carry prices higher for a considerable length of time, we do not recommend buying shares in the Rydex Precious Metals Fund [RYPMX], which is our benchmark gold mutual fund. Instead, we believe the best strategy is to go temporarily long the lower-priced gold shares. Specifically, we are bullish penny golds such as Campbell Resources [CCH], which shows great breakout potential and is an excellent way to attain leverage in your investments due to its extremely affordable price. We also like the chart for Anglogold Ltd. [AU], which, while not a penny gold, sports a bullish descending triangle pattern in its chart. The tape for AU looks good, as well. Another bullish-looking chart is the one for Stillwater Mining [SWC], which displays a classic "teacup" pattern.
We recently recommended Meridian Gold [MDG], which is in our estimation a winning prospect for 2000. This is what we told Dick Davis Digest when asked our favorite gold stock for 2000: A low-priced pure play, Meridian sports a chart pattern very similar to the pattern in the chart for gold futures--a sign that the stock's fortunes are tied closely to the yellow metal itself. Since we are bullish on gold (although we do not foresee a major bull market in gold in 2000) we are even more bullish on Meridian due to the advantage of leverage that Meridian has. Meridian is presently climbing a rising trendline, and most of the speculative activity in recent months has occurred on upside volume--a sign that there are more buyers than sellers. Hold above $6/share and accumulate above $8, becoming more aggressive with your purchases above the $9 resistance level.
In the bigger picture, 2000 likely will not be the beginning of gold's next bull cycle. What it will likely represent, however, is an excellent opportunity to make short- and intermediate-term profits throughout the year as we expect the latter part of the year to witness the beginning of the Great Global Debt Collapse. This will be an ideal time to own physical bullion since it will be preferred over debased currencies that will not be favored in a time of monetary panic. All in all, 2000 should be a lot better than 1998-1999 for gold investors, even if it doesn't bring the much longed-for gold bull.
Note to readers: Our new Web site can be viewed at www.tapetellsall.com
We plan on adding a commodities commentary section to our existing stock market commentary section in the near future, so keep in touch.


