Gold To Equities Ratios Have Bottomed


 It has been a strong start to 2016 in precious metals, today notwithstanding. Gold was able to break above daily resistance at $1080 to $1090 while miners climbed higher until Friday’s reversal. Rather than focus on the nominal gains, I want to turn our attention to Gold’s performance against other markets and asset classes. It is starting to turn in Gold’s favor and that is imperative if the precious metals bear market is to end in 2016.
We plot Gold against various equity markets in the chart below. These are daily line charts that include the 400-day moving average. Note how the moving average has been an excellent indicator of trend. At the bottom of the chart, we see that Gold last year broke its downtrend against emerging markets. The ratio is holding well above the moving average and nearing a test of its two year high. Gold against the NYSE and global equities is more interesting. The two ratios appear to have bottomed and are in the process of transitioning from downtrends to uptrends. It may take a few months or longer but we expect it to happen this year.
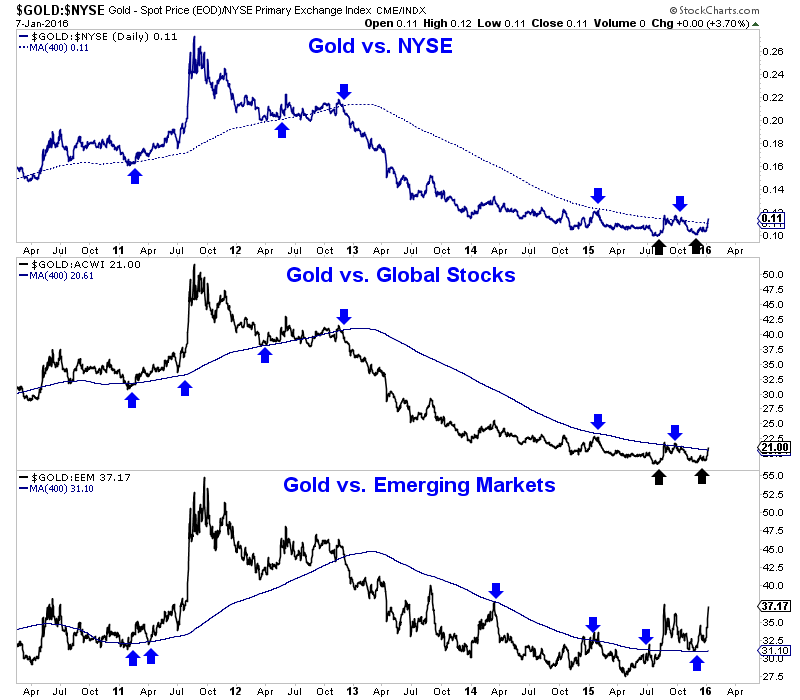
Gold vs. Equities
Gold’s relative strength is also apparent in the context of foreign currencies. We plot Gold against foreign currencies (FC) and Gold in US$ below. Although Gold/FC recently lost its 400-dma it rebounded after testing trendline support. Gold/FC has made higher lows over the past two years while Gold has made lower lows. This is not a total surprise given how Gold/FC has led Gold at key sector bottoms dating back to 2008, 2005 and 2001.
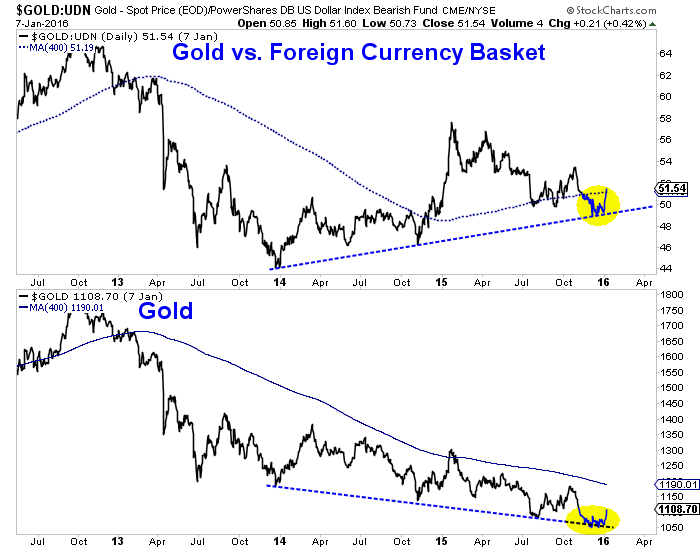
Gold vs. Foreign Currencies
Gold’s performance against other asset classes such as equities and currencies gives us additional insight to its current and future trend. We continue to expect the US$ to strengthen and Gold to have another leg down before its bear market ends. Gold’s performance against equities and foreign currencies can help us decipher the size and scope of Gold’s next leg down. If Gold is breaking out relative to stocks and holding strong against foreign currencies amid a nominal decline then Gold is gaining underlying strength and will be in position to rebound substantially when its nominal decline ends.
As for the short-term, we have rally targets of $1120 and $1130 to $1140 for Gold. Despite the strong decline in miners today we feel the group (GDX, GDXJ) has minimum upside targets at the 200-day moving averages. We intend to hedge our long positions when we feel the downside risk is increasing and we hope to be buyers in the event of sub $1000 Gold.
********
Jordan Roy-Byrne, CMT

Jordan Roy-Byrne, CMT is a Chartered Market Technician and member of the Market Technicians Association. He is the publisher and editor of TheDailyGold Premium, a publication which emphasizes market timing and stock selection, as well as TheDailyGold Global, an add-on service for subscribers which covers global capital markets. He is also the author of the 2015 book, The Coming Renewal of Gold’s Secular Bull Market which is available for free. TheDailyGold.com was recently named one of the top 50 Investment Blogs by DailyReckoning and WalletHub.


