Gold Forecast: The Boring Price Action In Gold Miners


 So, gold miners moved higher yesterday. What does this daily rally change? Nothing.
There are days when things are particularly interesting and many things change. Yesterday was not one of those days.
The price action in the GDX ETF was relatively boring, and the same goes for other markets as well. In the case of gold, this boredom is actually bearish, but we’ll get to that shortly. For now, let’s take a look at the GDX chart.
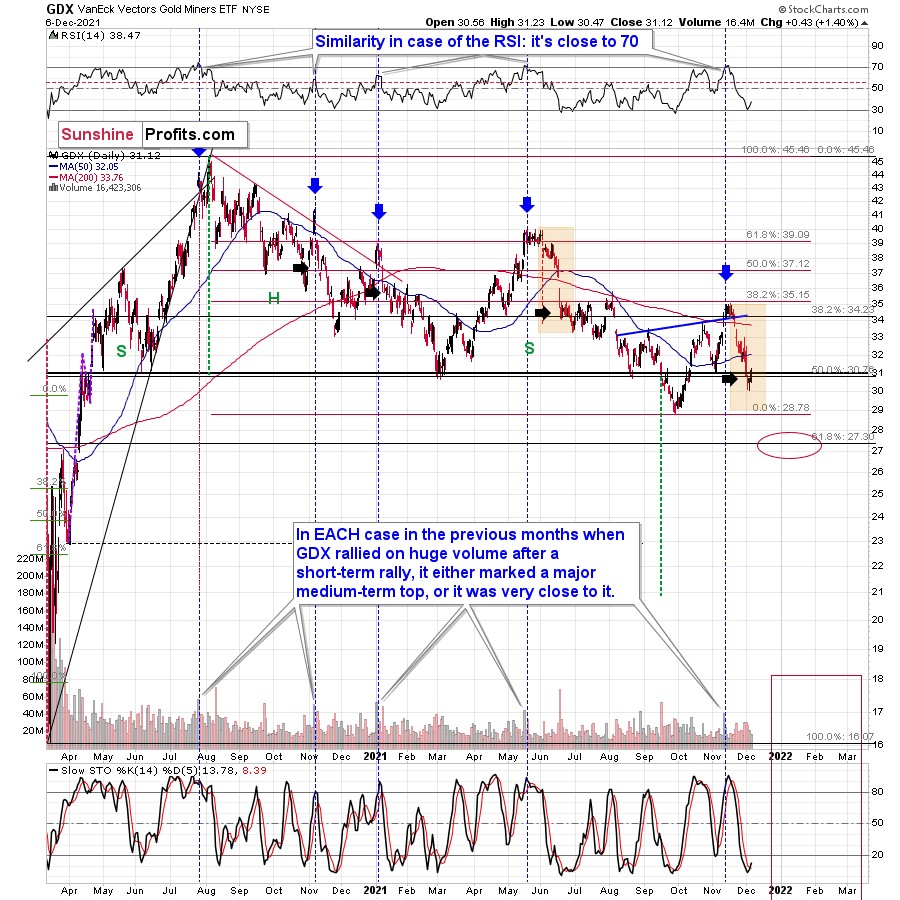
We saw a small upswing, which is in tune with what we saw previously after sharp rallies that followed high-volume rallies/tops. I marked those previous high-volume sessions with blue vertical lines and in three out of four previous cases, I also placed black arrows after the initial part of the decline.
I did that to illustrate what happened in those previous cases and to provide the context for what happened yesterday. In those three cases, we saw tiny upswings that were then followed by lower prices. So, that is the default price action that one should expect here. And, well, that’s what happened yesterday. Expected, regular – and boring.
On a side note, I’m not saying that the situation being “boring” is a bad thing. If the markets only do boring stuff – behaving as expected – it means that they will likely do things more or less in tune with their outlook, which in turn means that they will likely move in tune with our trading positions, thus making them more profitable.
In this case, the daily move up is not in tune with them, but it’s in tune with the bigger – and very bearish – picture, which is positive for our trading positions as it increases the chances that they will become very, very, very profitable in the not-too-distant future.
The volume that accompanied yesterday’s small upswing was relatively low, so that’s also something suggesting that the increase was just a breather within a decline.
The GDX also moved close to its early-November lows, so let’s zoom in.
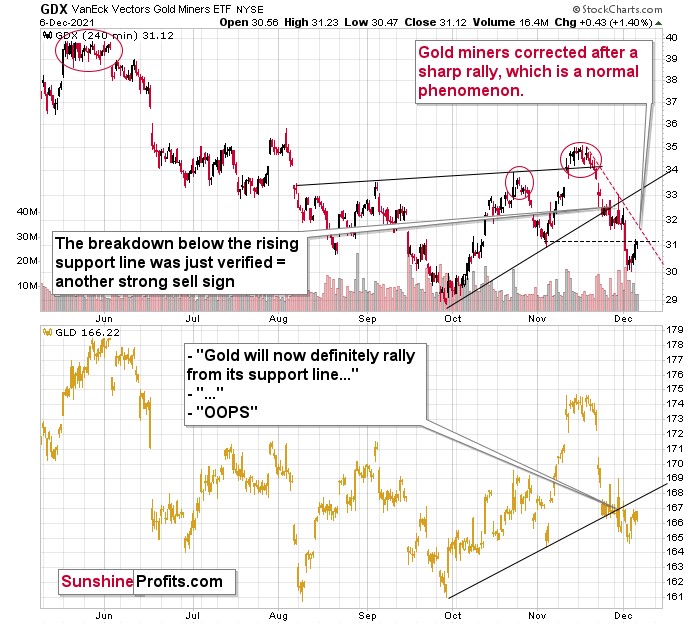
After verifying the breakdown below its rising support line, the GDX moved lower, just as I expected it to. Now it’s after a breakdown below its previous (November) lows, and it seems to be verifying that breakdown just as it verified the breakdown below the rising support line in late November.
The black dashed line in the above chart shows the resistance provided by the previous lows. It wasn’t invalidated. At the same time, the GDX is well below its declining red resistance line, and even if it moves close to this line but then declines, it will not be viewed as something bullish.
But will it really move higher? I wouldn’t bet the farm on that scenario. Why? Because, for instance, the breakdown in the GLD ETF has been more than verified, and it seems that the flagship ETF for gold is now ready to slide lower - and if it does, miners are likely to slide as well.
By the way, please note that junior miners are once again declining more than senior miners, also in tune with my previous expectations.
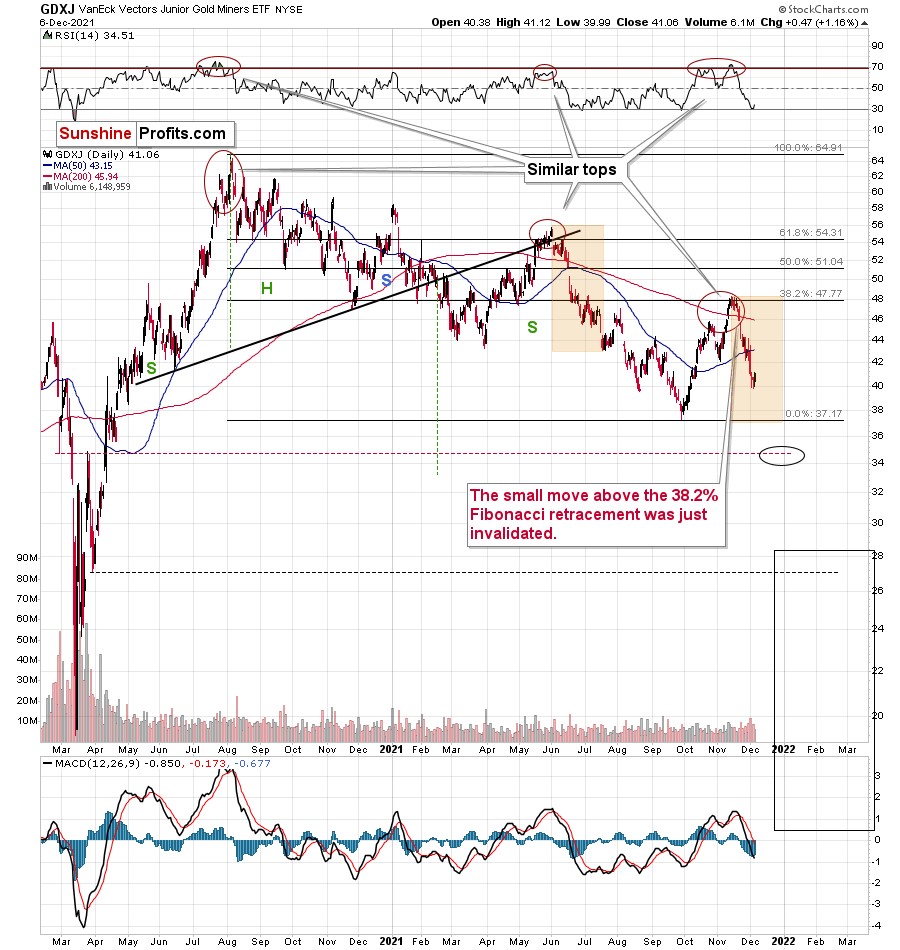
While the GDX ETF moved back to its November lows, the GDXJ ETF (a proxy for junior mining stocks) is well below the analogous lows.
What’s likely to happen next? Well… let’s take a look at gold.
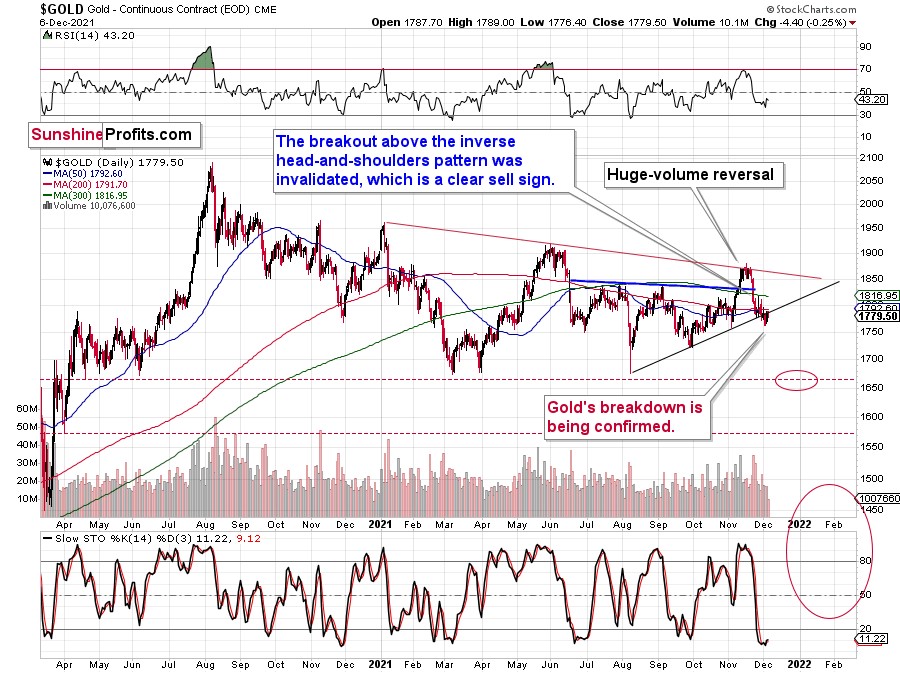
Gold is after a breakdown below its rising support line based on previous lows, and this breakdown is now being verified.
Gold broke below this support line on Thursday (Dec. 2), moved back to it on Friday (Dec. 3) without breaking back above it, and declined once again yesterday (Dec. 6). The decline was not huge (just $4.40), but it was enough as what counts is that it was the third consecutive trading day during which gold didn’t invalidate the breakdown. This makes it a confirmed breakdown, with very bearish implications going forward.
In this environment, gold, silver, and mining stocks are likely to move lower in the short term.
This is especially the case given that the USD Index is likely to move higher once again.
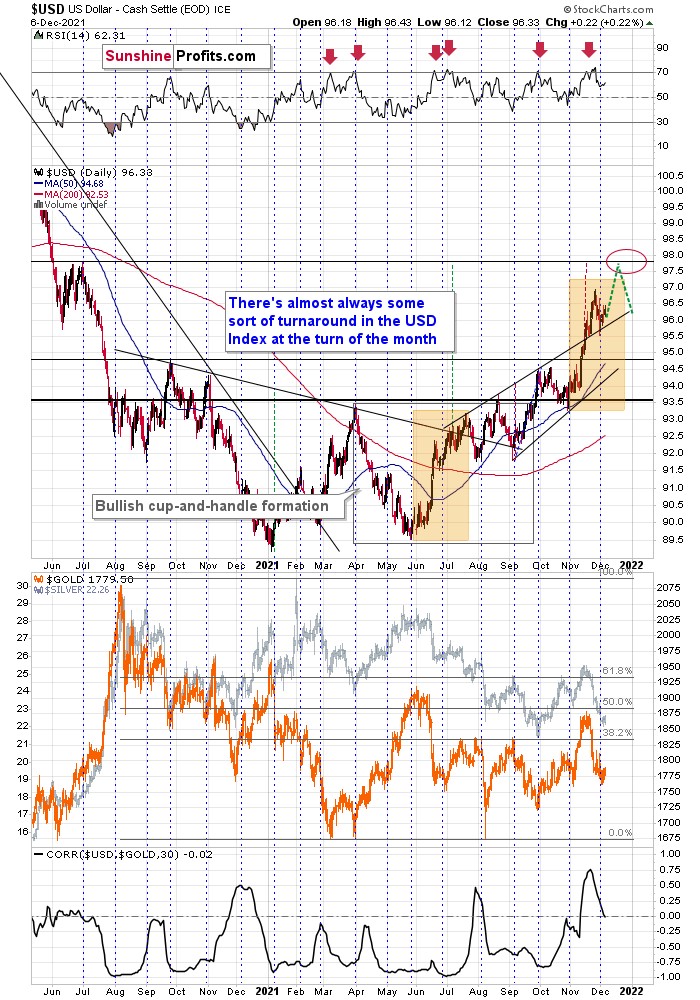
This would be in tune with what I wrote previously about the shape of the USD’s rally. Namely, that the July performance is being somewhat repeated.
This time, though, it seems that the upside target might be higher than the upper part of the orange rectangle (which would make this and the mid-2021 rallies identical).
Namely, there’s strong resistance provided by the mid-2020 high, and there’s also another trading technique pointing to the proximity of 98 to be the target for the current rally.
The USD Index broke above the rising wedge, and it then verified the breakout above this wedge (that’s the recent short-term decline). The size of the rally that is likely to follow the breakout is quite likely to be equal or similar to the width of the wedge. I marked that with red, dashed lines, and this technique confirms the target just below the 98 level.
I also marked the USD’s most likely short-term price path with green lines. It seems to me that the USD Index will rally soon, and then correct to more or less current levels (or perhaps lower).
The short-term upswing could trigger gold’s decline to the previous lows, while the following corrective pullback in the USDX could trigger gold’s corrective upswing (from its 2021 lows). This would be in perfect tune with what happened in 2013 right before the huge slide in the precious metals and mining stocks.
The mid-December FOMC could be the turning moment for the U.S. dollar and for other markets, but it’s not 100% clear whether it will be this development that triggers the short-term reversal.
So, all in all, the short-term outlook for the precious metals market remains bearish, and so does the outlook for the next few months. It’s likely that we’ll see some kind of a rebound once gold moves to its previous 2021 lows, though.
Thank you for reading our free analysis today. Please note that it is just a small fraction of today’s all-encompassing Gold & Silver Trading Alert. The latter includes multiple premium details such as the outline of our trading strategy as gold moves lower.
If you’d like to read those premium details, we have good news for you. As soon as you sign up for our free gold newsletter, you’ll get a free 7-day no-obligation trial access to our premium Gold & Silver Trading Alerts. It’s really free – sign up today.
Przemyslaw Radomski, CFA
Founder, Editor-in-chief
Sunshine Profits - Effective Investments through Diligence and Care
* * * * *
All essays, research and information found above represent analyses and opinions of Przemyslaw Radomski, CFA and Sunshine Profits' associates only. As such, it may prove wrong and be subject to change without notice. Opinions and analyses are based on data available to authors of respective essays at the time of writing. Although the information provided above is based on careful research and sources that are deemed to be accurate, Przemyslaw Radomski, CFA and his associates do not guarantee the accuracy or thoroughness of the data or information reported. The opinions published above are neither an offer nor a recommendation to purchase or sell any securities. Mr. Radomski is not a Registered Securities Advisor. By reading Przemyslaw Radomski's, CFA reports you fully agree that he will not be held responsible or liable for any decisions you make regarding any information provided in these reports. Investing, trading and speculation in any financial markets may involve high risk of loss. Przemyslaw Radomski, CFA, Sunshine Profits' employees and affiliates as well as members of their families may have a short or long position in any securities, including those mentioned in any of the reports or essays, and may make additional purchases and/or sales of those securities without notice.
*********
 Przemyslaw Radomski, CFA, is the founder, owner and the main editor of SunshineProfits.com. You can reach Przemyslaw at: http://www.sunshineprofits.com/help/contact-us/.


