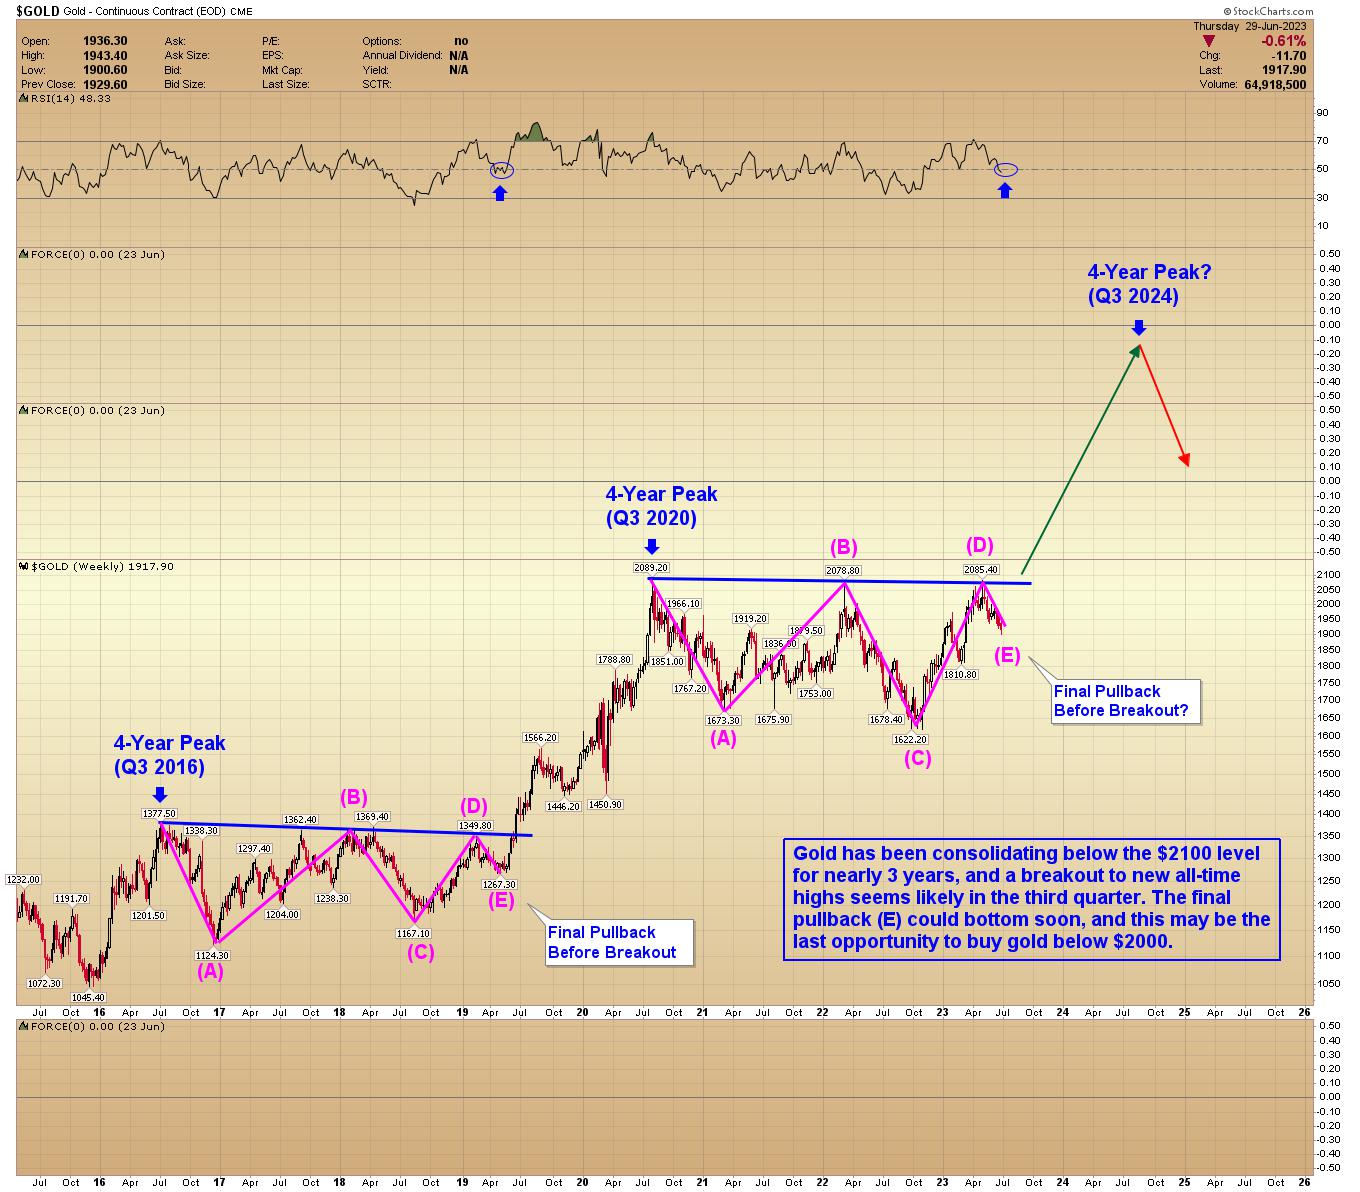
Gold Forecast - Bullish Price Chart Supports $3000 Target in 2024


This is one of the most bullish gold charts I've seen in a long time. The three-year consolidation is almost complete, and we expect a rally towards $3000 over the next 12 to 18 months. Gold miners could explode higher, and silver may retest $50.
The gold market has three phases:
1) Panic and Despair
2) Boredom and Complacency
3) Excitement and Exuberance
After three years of going nowhere, the complacency phase is ending, and we are about to enter phase 3. Congratulations if you made it this far without selling your positions; your endurance is about to be rewarded.
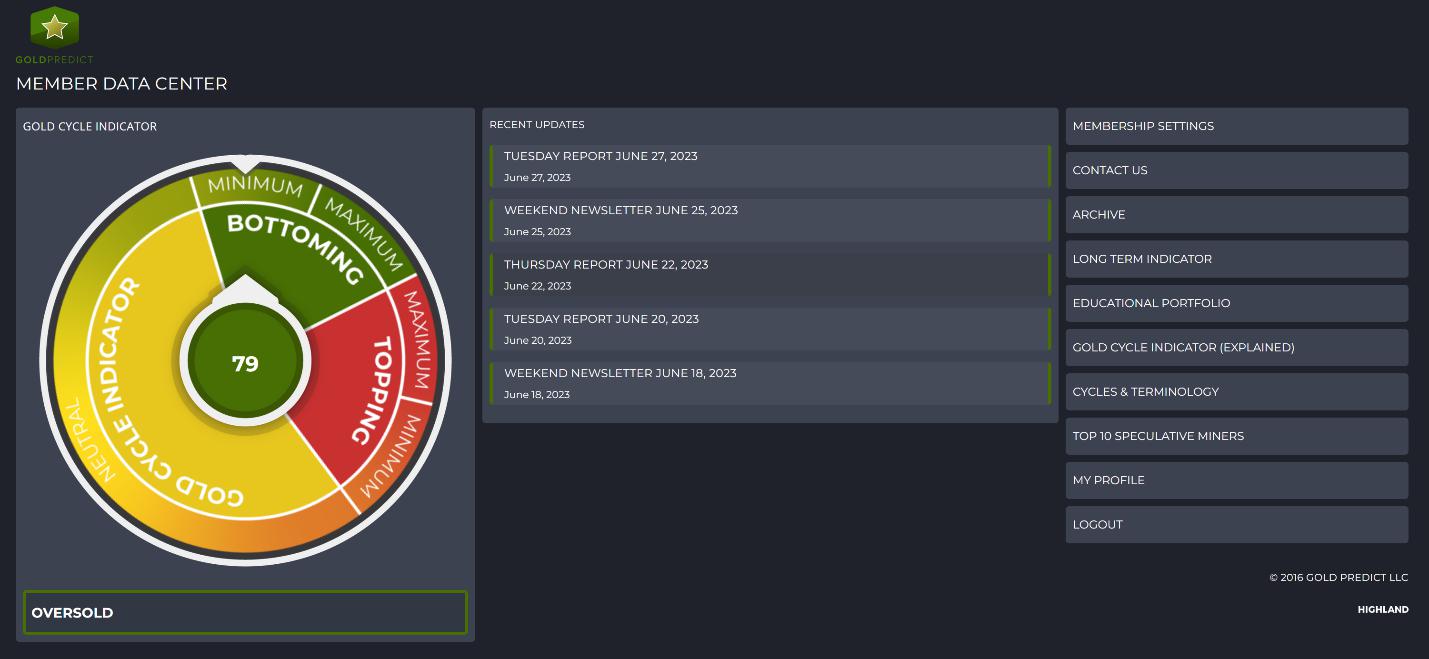
Our Gold Cycle Indicator finished at 79 on Thursday, a fresh low for this cycle, suggesting we may be near the bottom.
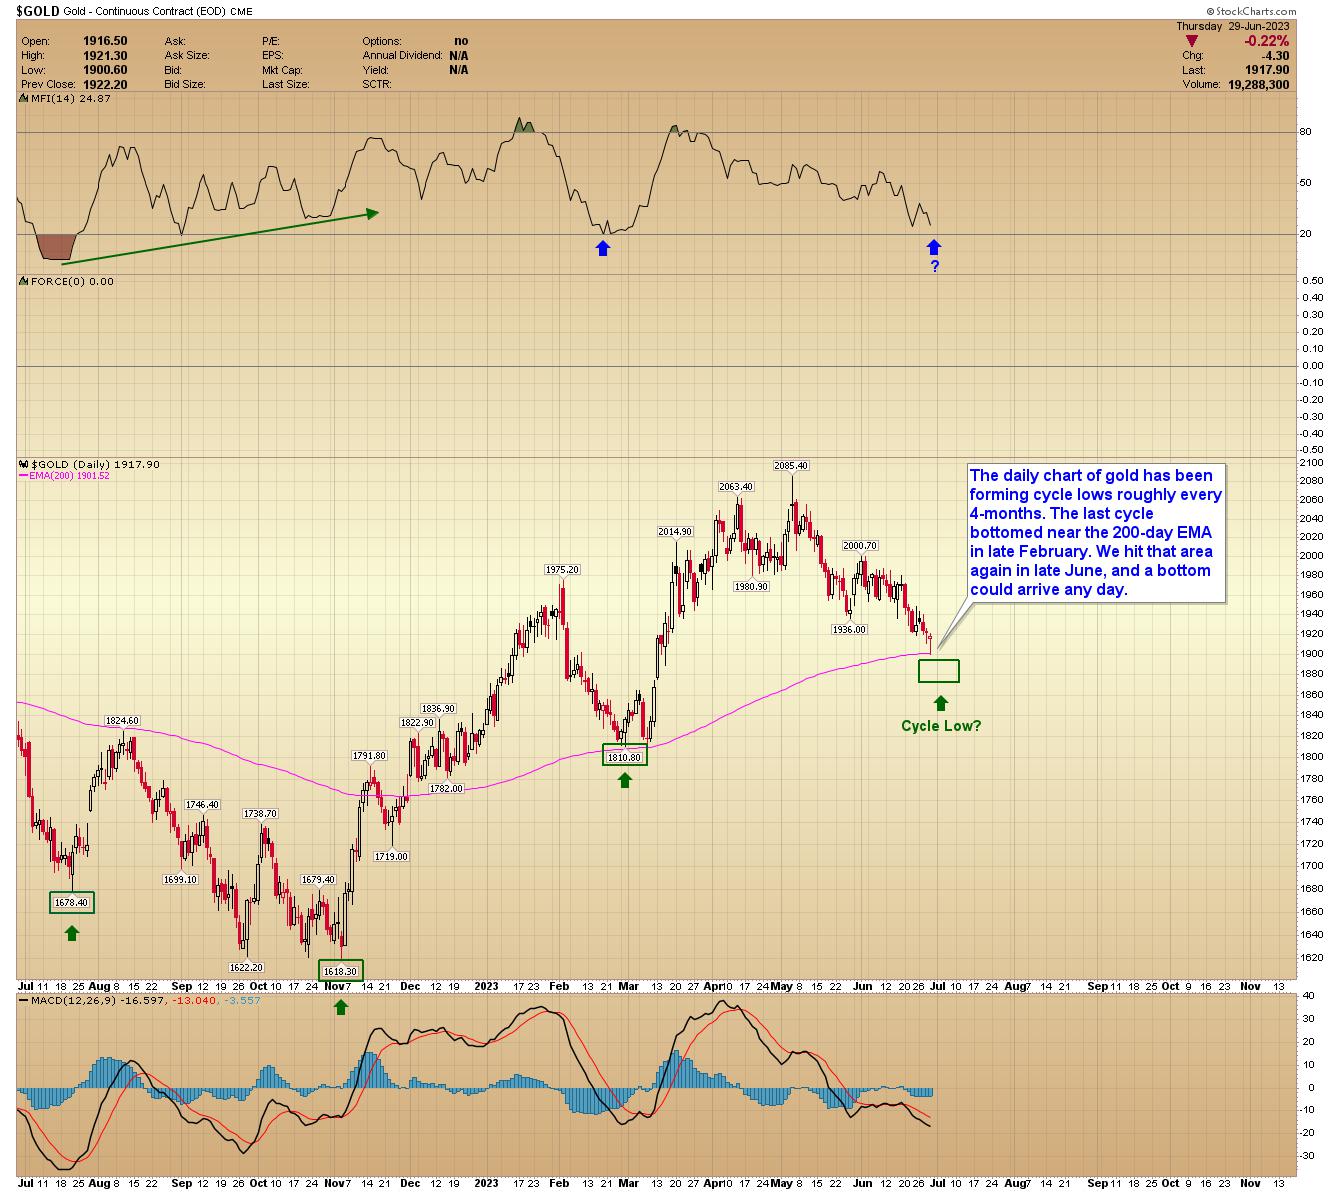
GOLD DAILY CHART: The daily chart of gold has been forming cycle lows roughly every 4-months. The last cycle bottomed near the 200-day EMA in late February. We hit that area again in late June, and a bottom could arrive any day.
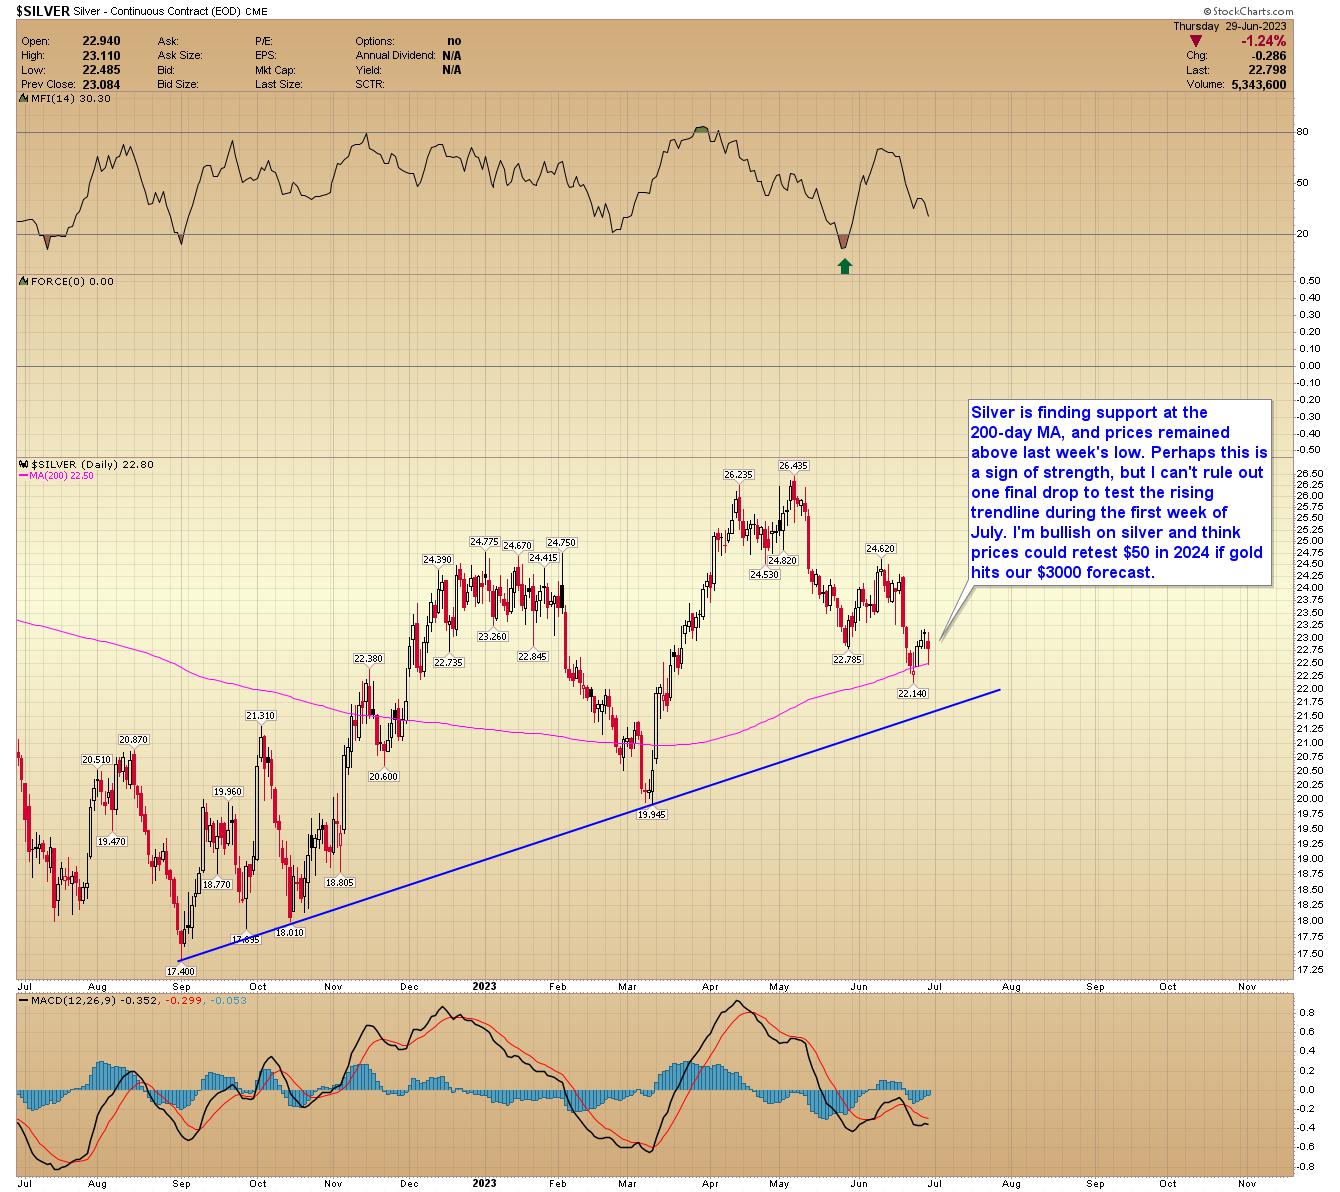
SILVER DAILY CHART: Silver is finding support at the 200-day MA, and prices remained above last week's low. Perhaps this is a sign of strength, but I can't rule out one final drop to test the rising trendline during the first week of July. I'm bullish on silver and think prices could retest $50 in 2024 if gold hits our $3000 forecast.
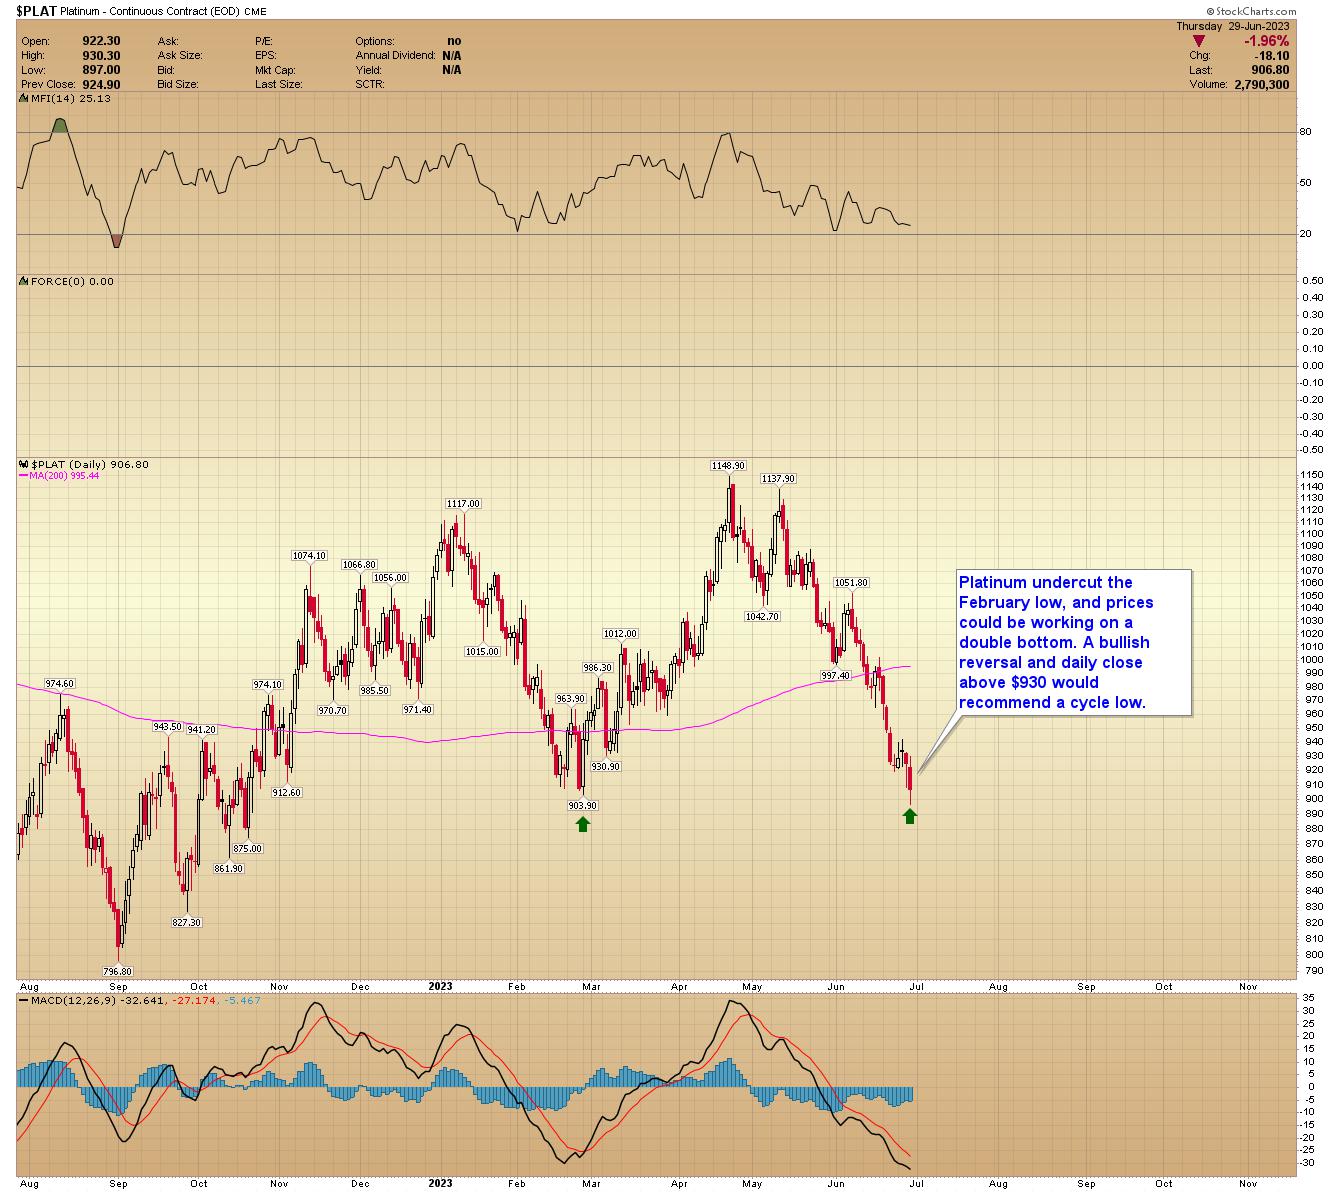
PLATINUM DIALY CHART: Platinum undercut the February low, and prices could be working on a double bottom. A bullish reversal and daily close above $930 would recommend a cycle low.
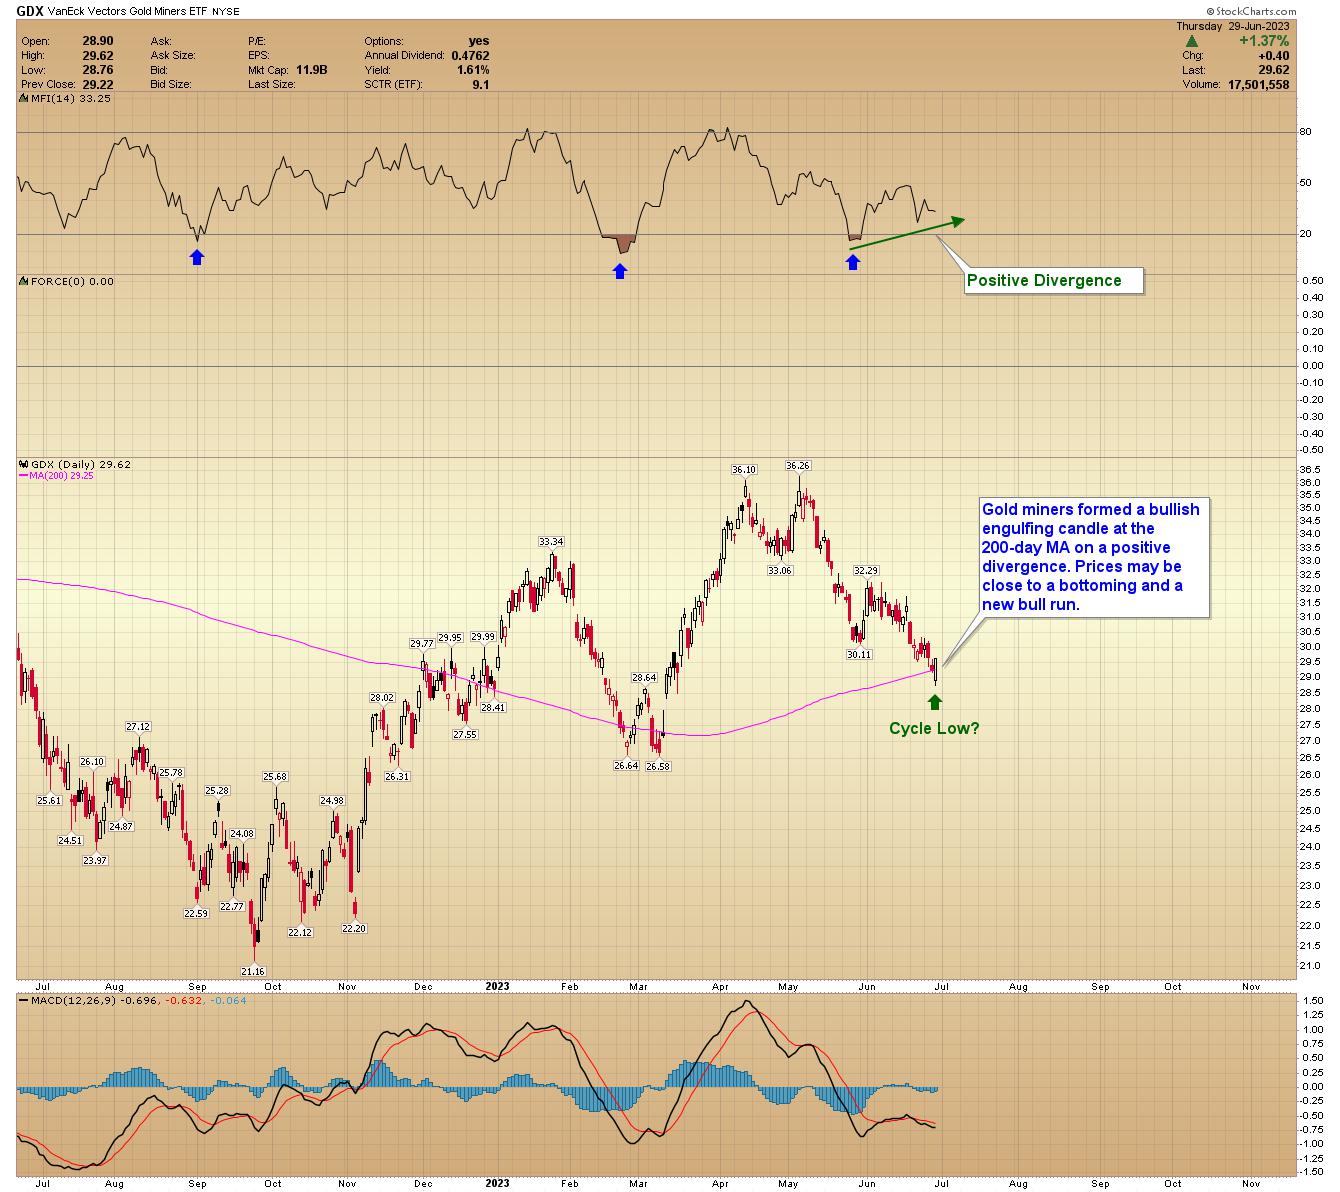
GDX DAILY CHART: Gold miners formed a bullish engulfing candle at the 200-day MA on a positive divergence. Prices may be close to a bottoming and a new bull run.
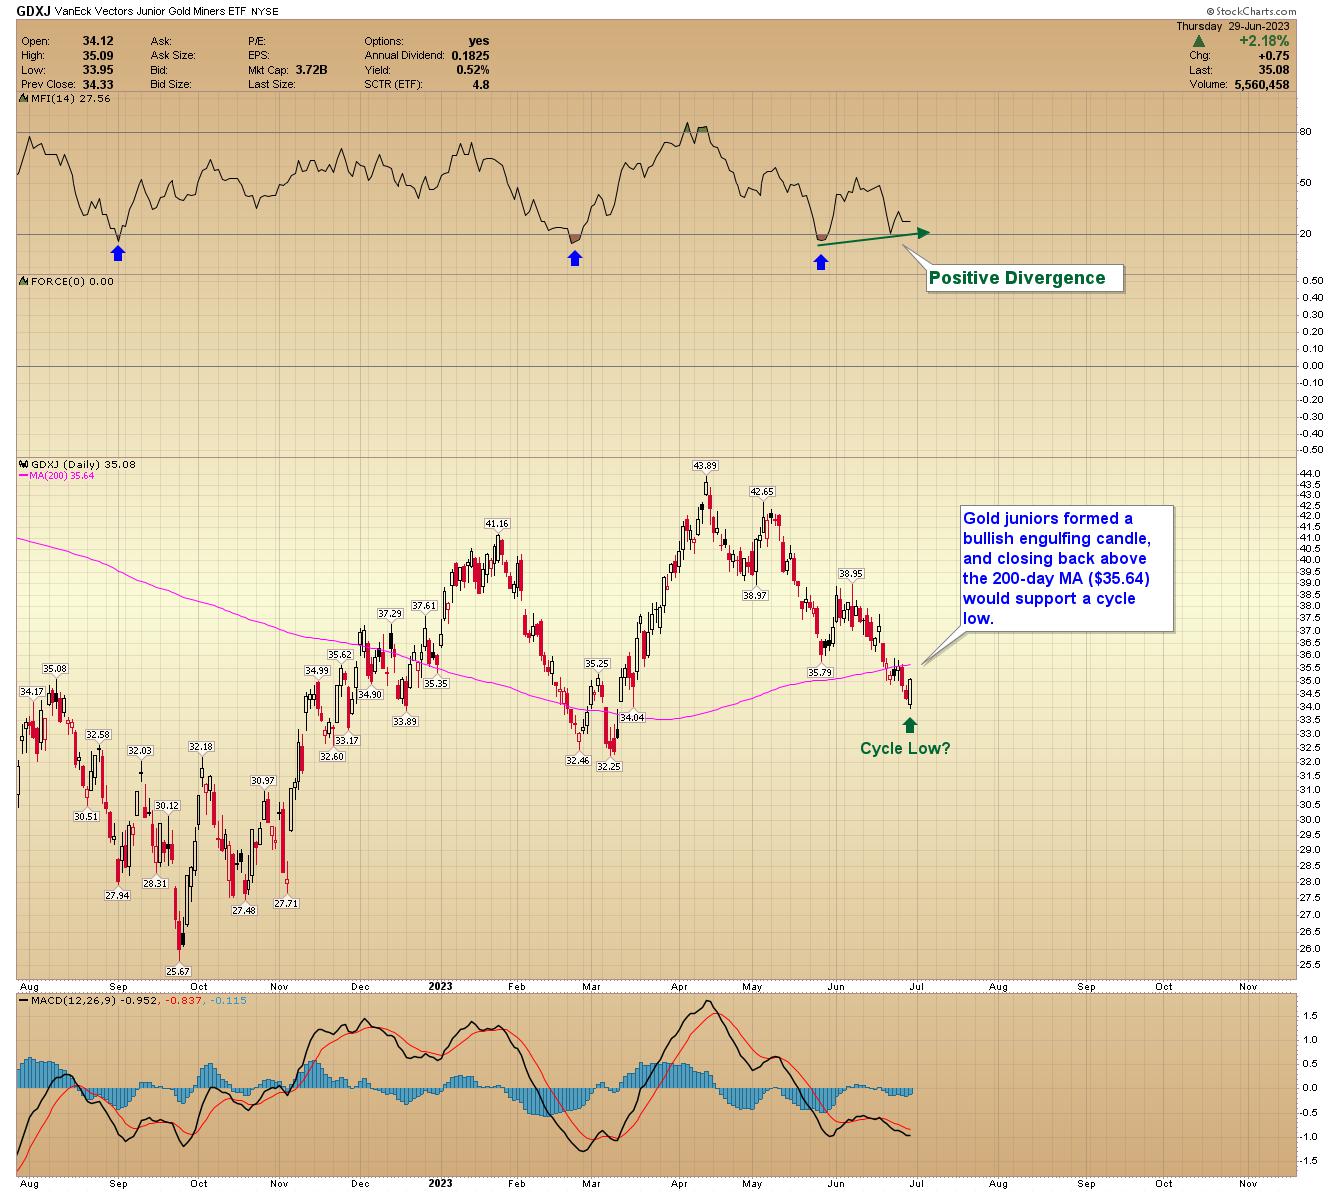
GDXJ DAILY CHART: Gold juniors formed a bullish engulfing candle, and closing back above the 200-day MA ($35.64) would support a cycle low.
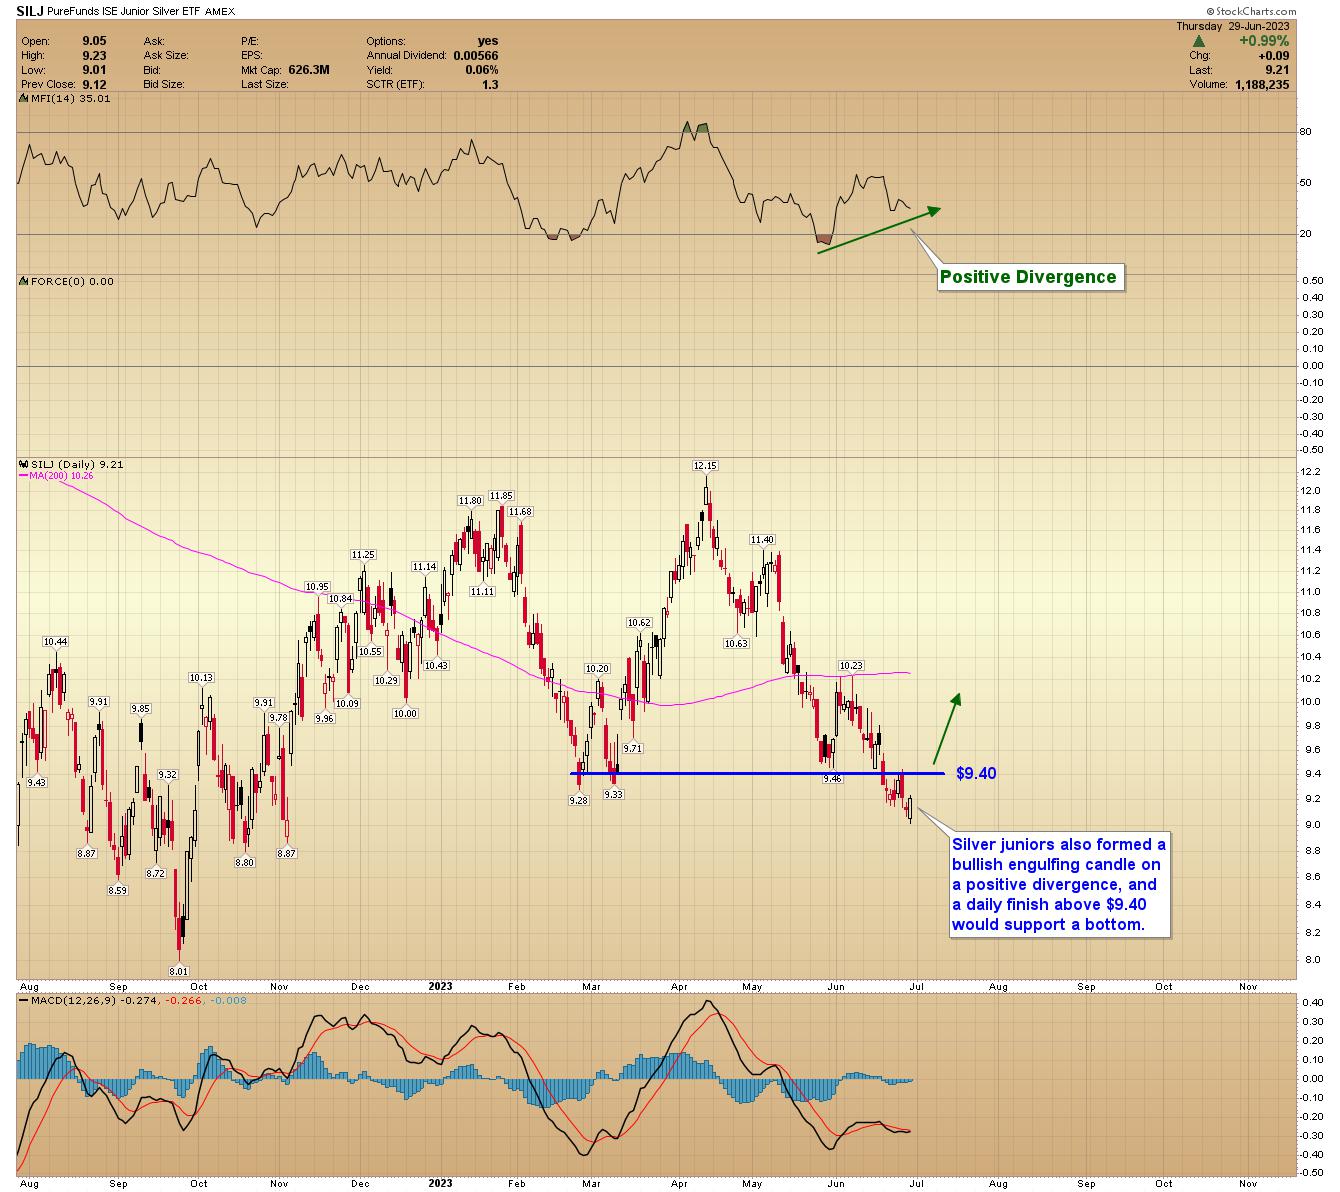
SILVER JUNIORS: Silver juniors also formed a bullish engulfing candle on a positive divergence, and a daily finish above $9.40 would support a bottom.
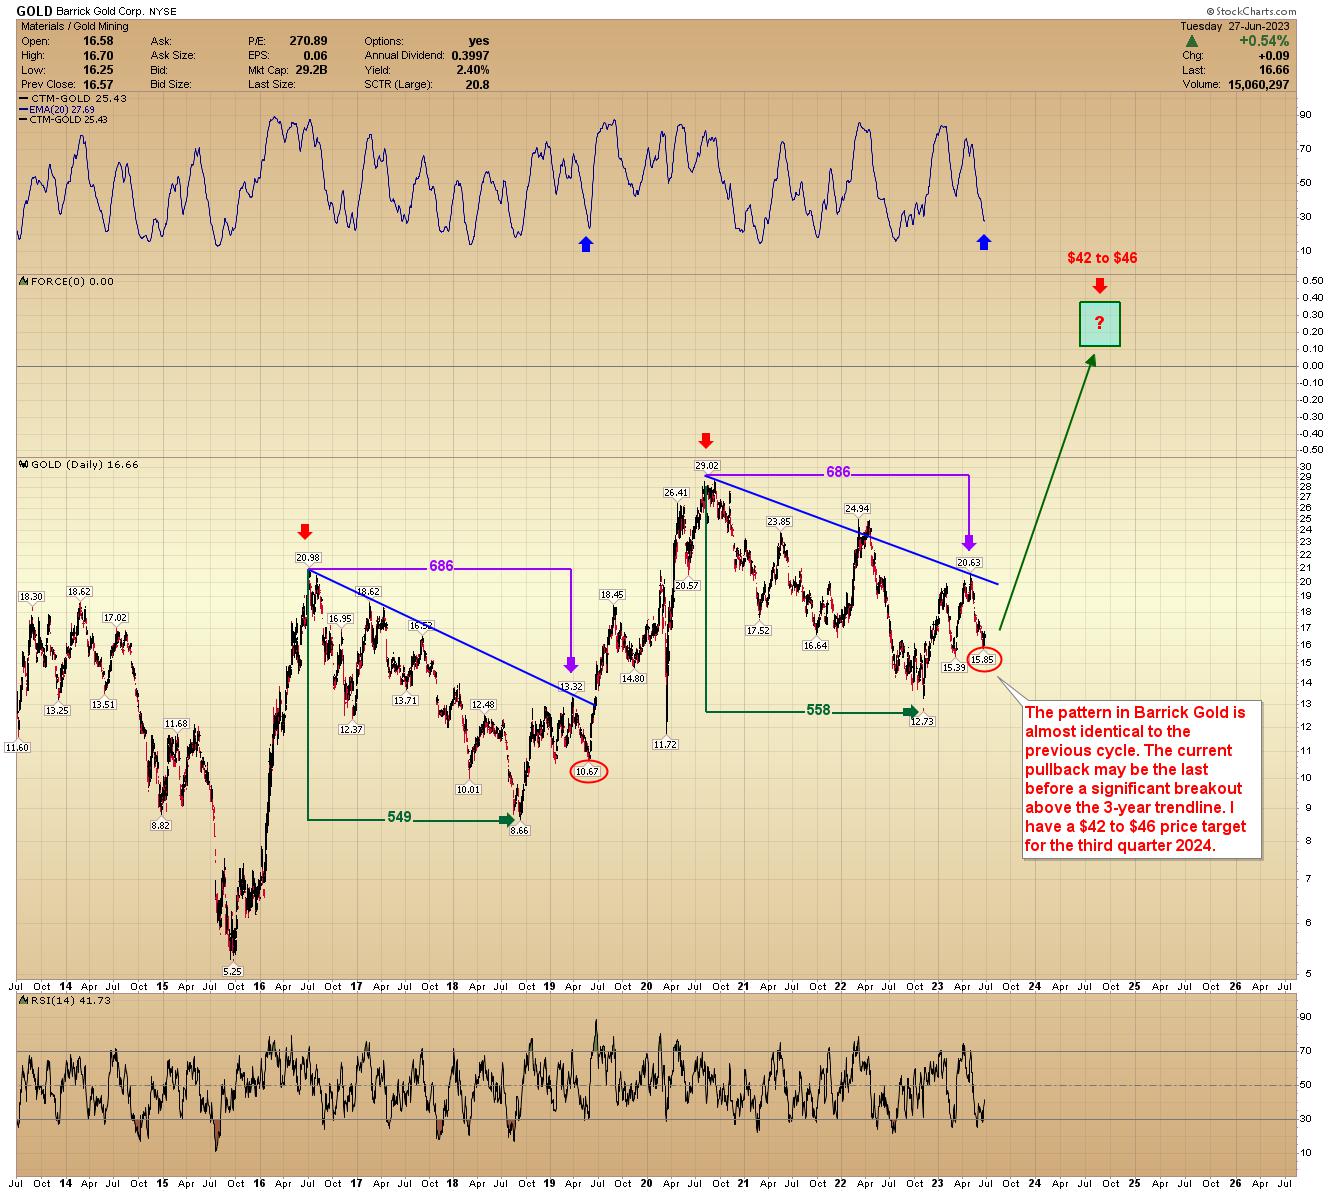
BARRICK GOLD: The pattern in Barrick Gold is almost identical to the previous cycle. The current pullback may be the last before a significant breakout above the 3-year trendline. I have a $42 to $46 price target for the third quarter 2024.
Conclusion
The gold train is about to leave the station, and the next 12 to 18 months should be exhilarating. Timing the exact bottom is irrelevant if gold reaches our $3000 target in 2024. Gold miners should benefit greatly; some could rally 200% or more.

*********


