Gold Forecast: Downward Implications of U.S. Labor Day
 share
share
 share
share
 share
share
 share
share
 share
share
 On Friday, gold soared based on the surprisingly weak jobs report. This week, gold declined over 1.5x as much as it rallied on Friday, and it happened based on… no news announcement. I wrote multiple times in the past that gold doesn’t need a trigger to decline if it’s clear that it really wants to do so based on its trend and its relative strength (or lack thereof) compared to things that should make it move higher. Yesterday’s decline serves as a perfect confirmation. What happened? Nothing. How did gold react? It declined by over $30 from Friday’s close.
Ok, it’s not 100% precise that nothing happened. The U.S. Labor Day happened, and I previously emphasized how very likely it was for gold to decline after this day, based on a very specific and efficient cyclicality.
Quoting my September 1 Gold & Silver Trading Alert:
The cyclical nature of many areas of life is present in the markets, and it is usually the case that the seasonal factors have only a mild effect on the prices and other factors are much more important, as they are specific to a given situation. Sometimes, however, we have a recurring event that’s so precise in its implications and so accurate that its importance could dwarf other techniques.
This could be the case with gold’s post-U.S.-Labor-Day performance.
A poet might say that at that time a golden dolphin jumps joyfully into the air, shining briefly in the evening sun, preparing for a deep and dangerous dive.
A data scientist might say that 10 out of 10 efficiency with regard to short-term implications and 8 out of 10 performance with regard to medium-term implications is something that seems opposite to the efficient market theory, even in its weak form.
And a trader might say “great! let’s make some money on it!”
I’ll let you be the judge as to which approach is best, while I will feature my observations regarding gold’s price performance around the U.S. Labor Day.
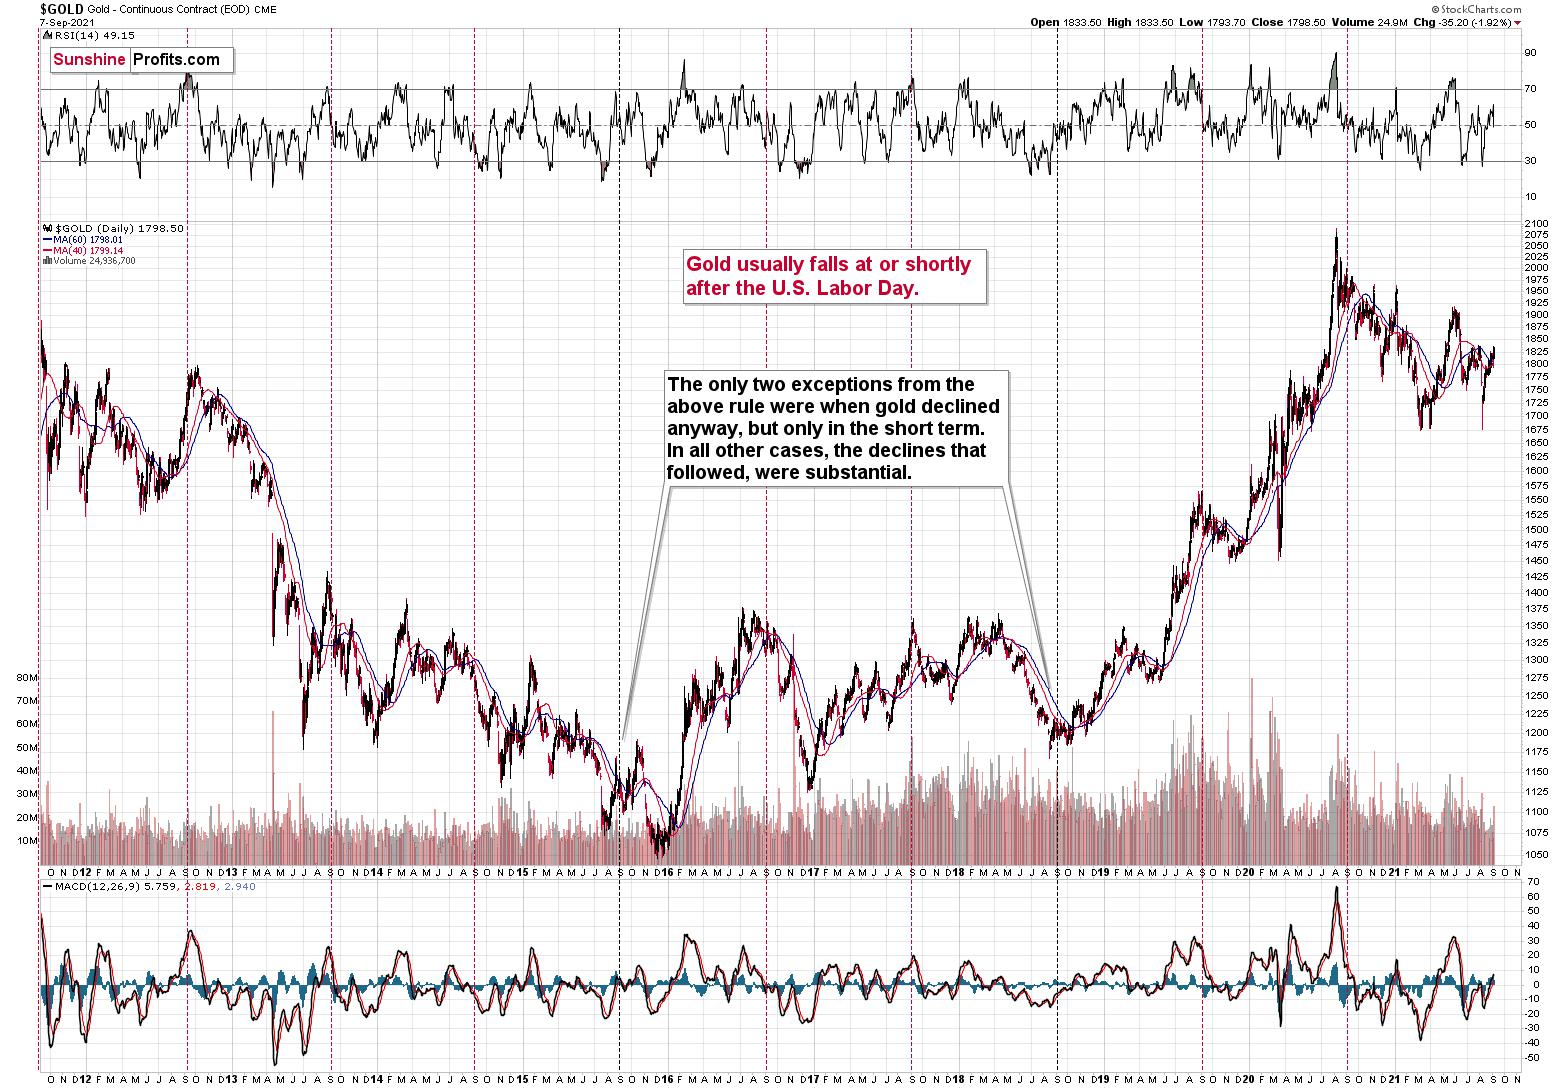
You see, in the previous 10 years, gold almost always declined profoundly right after the U.S. Labor Day — I marked that on the above chart with red, dashed lines. There were only two cases (in 2015 and in 2018) when gold didn’t slide profoundly after that day, but… it was when gold declined in the short term anyway. There was simply no major downswing later.
In other words, in all 10 out of the previous 10 years, gold moved lower in the short term after the U.S. Labor Day. Of course, it’s debatable what one describes as the short term. In this case, I mean a period between a few days and a few weeks. Then again, if you look at the chart, it’s clear what we can expect. Please have a look at how far gold usually fell (red lines) and how far it fell during the exceptionally bullish years when it declined just in the short run.
This is very important, as it tells us that even if gold doesn’t decline this week, it will be very likely to do so based on this surprisingly accurate cyclicality.
So, gold was likely to decline this week, and it has done exactly that so far. But that’s not the most important point of the above quote. The most important point is that in 8 out of the previous 10 cases of post-U.S.-Labor-Day declines, these declines were big. This week’s $30+ decline in gold may seem sizable on a day-to-day basis, but it’s nothing compared to what’s likely to happen based just on the above-mentioned analogy.
More Things to Spot
Moreover, that’s not the only profoundly bearish analogy out there. The link between now and 2013 is very strong, not only in terms of what’s happening in gold but also in terms of what’s happening in gold stocks.
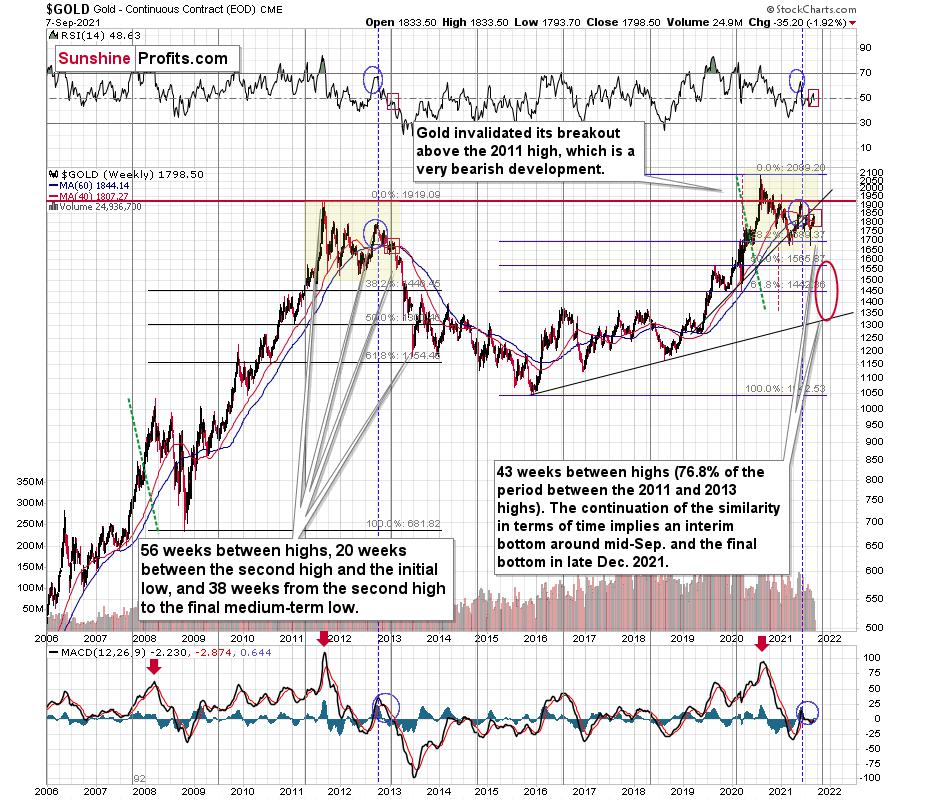
I marked the most similar long-term patterns with yellow rectangles. The blue ellipses and red rectangles emphasize the comparable performance in the RSI indicator, as well as in the MACD indicator, and in terms of gold price itself that recently moved above its 40-week moving average and close to its 60-week moving average.
It’s quite clear that what we see right now is a very good rhyme to what we saw at the beginning of 2013. And if there ever was a good time not to be long gold (except for owning it as insurance) or silver, it was back then, as it was right before the 2013 slide.
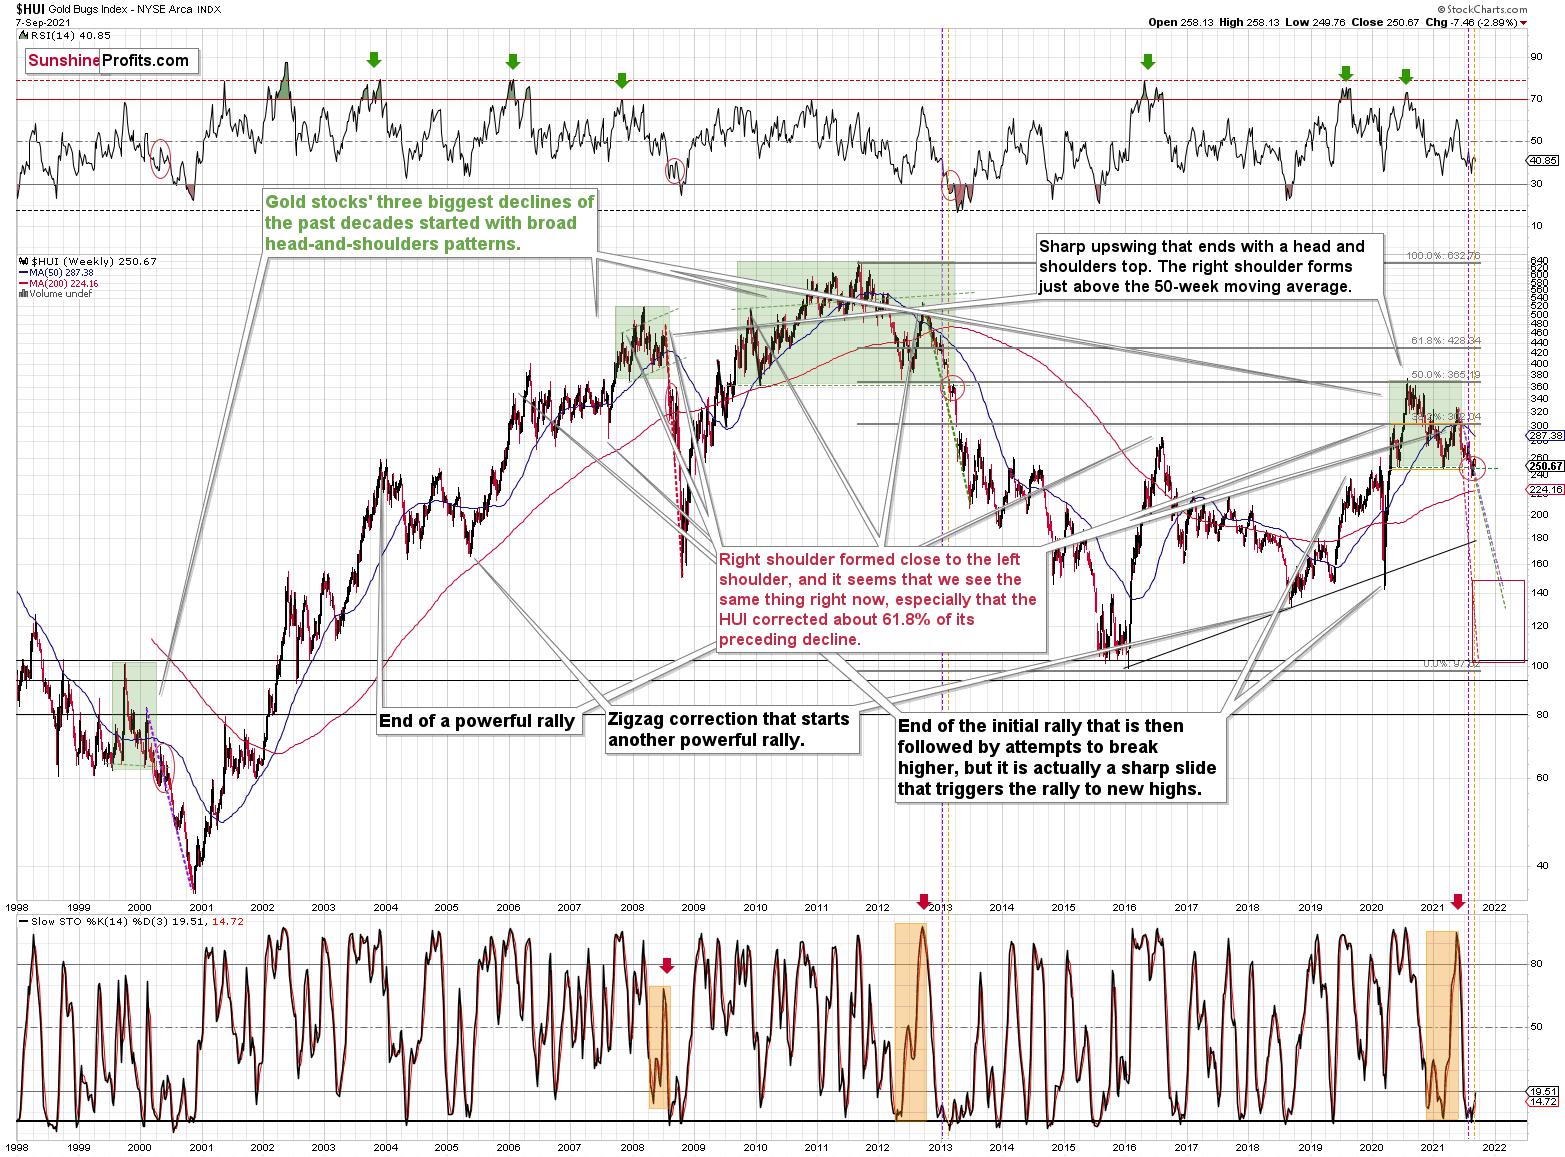
The long-term HUI Index points to the same thing. Back in 2013, the biggest corrective upswing that we saw after the breakdown below the broad (marked with green) head and shoulders pattern took gold stocks above 8% higher. We saw the same thing in the last two weeks – gold miners moved up by about 8%, and they started this week with an almost 3% decline. It seems that history rhymed once again.
Summary
To summarize, even though we saw a sizable upswing on Friday, it doesn’t seem that it changes anything with regard to the bearish medium-term trend on the precious metals market. The key breakdowns / breakdowns were either not invalidated (euro, USD Index, silver, GDXJ) or were invalidated in a way that’s suspicious / in tune with what happened during the powerful 2013 slide (GDX, HUI Index).
And as silver often moves in close relation to the yellow metal, when gold falls, Silver is likely to decline as well – it has probably already started its slide. The times when gold is continuously trading well above the 2011 highs will come, but they are unlikely to be seen without being preceded by a sharp drop first.
Thank you for reading our free analysis today. Please note that it is just a small fraction of today’s all-encompassing Gold & Silver Trading Alert. The latter includes multiple premium details such as the outline of our trading strategy as gold moves lower.
If you’d like to read those premium details, we have good news for you. As soon as you sign up for our free gold newsletter, you’ll get a free 7-day no-obligation trial access to our premium Gold & Silver Trading Alerts. It’s really free – sign up today.
Thank you.
Przemyslaw Radomski, CFA
Founder, Editor-in-chief
Sunshine Profits - Effective Investments through Diligence and Care
* * * * *
All essays, research and information found above represent analyses and opinions of Przemyslaw Radomski, CFA and Sunshine Profits' associates only. As such, it may prove wrong and be subject to change without notice. Opinions and analyses are based on data available to authors of respective essays at the time of writing. Although the information provided above is based on careful research and sources that are deemed to be accurate, Przemyslaw Radomski, CFA and his associates do not guarantee the accuracy or thoroughness of the data or information reported. The opinions published above are neither an offer nor a recommendation to purchase or sell any securities. Mr. Radomski is not a Registered Securities Advisor. By reading Przemyslaw Radomski's, CFA reports you fully agree that he will not be held responsible or liable for any decisions you make regarding any information provided in these reports. Investing, trading and speculation in any financial markets may involve high risk of loss. Przemyslaw Radomski, CFA, Sunshine Profits' employees and affiliates as well as members of their families may have a short or long position in any securities, including those mentioned in any of the reports or essays, and may make additional purchases and/or sales of those securities without notice.
********
share
share
share
share
share
 Przemyslaw Radomski, CFA, is the founder, owner and the main editor of SunshineProfits.com. You can reach Przemyslaw at: http://www.sunshineprofits.com/help/contact-us/.


