Gold Forecast: Gold Cycles Bracing For Key Decline


Last week's trading saw gold holding in consolidation mode, with the metal forming its low in Tuesday's session, doing so with the tag of the 1791.10 figure. From there, strength was seen into a Wednesday high of 1819.50 - before seeing sideways action into Thursday/Friday.
Gold's Most Dominant Short-Term Cycle
As mentioned in past articles, the most dominant short-term cycle that we track is the 34-day wave, which is shown again on the chart below:
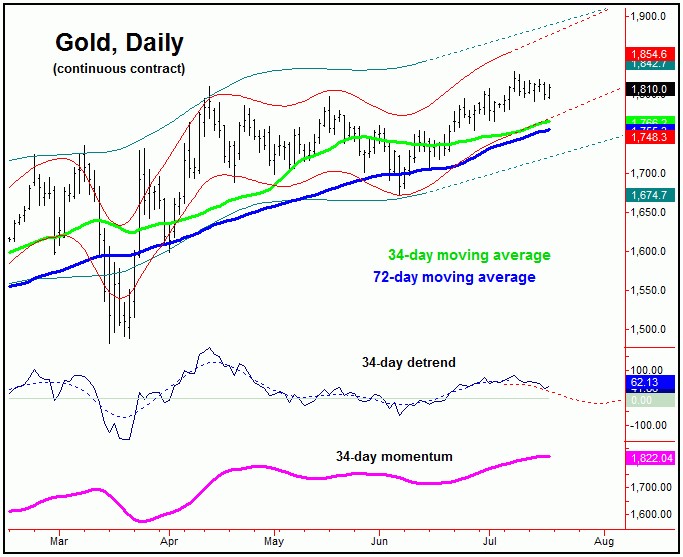
In looking at our 34-day cycle chart, of note is that the channels that track this wave are still pointing higher. Having said that, both the detrend and momentum indicators are beginning to roll over - which is a sign that the cycle itself is readying to turn. However, there are no indications from price that it has yet peaked, thus leaving the door open to a spike back to or above the recent highs in the coming days.
Once our 34-day wave does top out, then the minimum decline should see the 34 and 72-day moving averages acting as downside magnets. In terms of patterns, due to the bullish configuration of the larger-degree waves, the next downward phase of the 34-day cycle is favored to end up as a countertrend affair - meaning that it should remain above the June trough of 1671.70, its prior labeled low.
Take a look at the next chart, which shows the larger 72-day component:
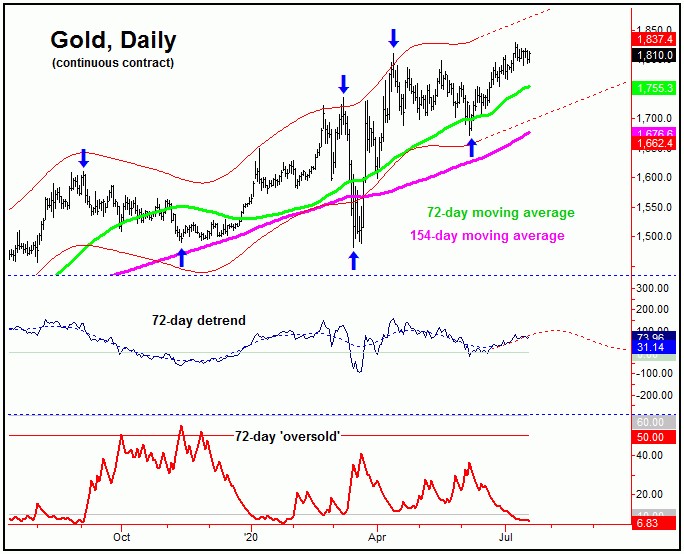
From the comments made over the past month, the upward phase of this 72-day cycle was seen as being in force off the early-June bottom, with that analysis calling for a new high for the larger swing - something we have easily seen met with the recent tag of the 1829.80 figure. In terms of time, the upward phase of this wave was projected higher into the mid-July timeframe or later.
Going further with the above, our 72-day chart shows the red 'oversold' indicator having moved below its lower reference line over the past week - something seen closer to tops for this wave. Note that this indicator moves inversely to price - similar to the VIX index, in relation to the S&P 500 index.
Gold's 3-6 Week View
Stepping back, however, the next correction of significance is due to materialize, and is expected to come from the larger 154-day cycle, shown below:
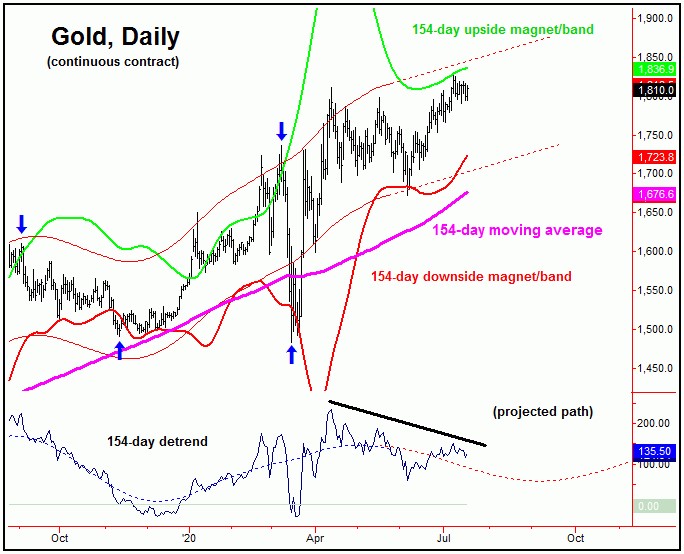
As pointed out in my last article, of particular interest is that our detrend indicator (lowest pane) registered a divergence against the recent new price high - something seen as a technical negative going forward. This action also tends to support the idea of a correction playing out with this wave in the coming weeks. More exact details of how we expect this correction to unfold - as well as when it is likely to bottom - are noted in our thrice-weekly Gold Wave Trader report.
Technical Signals
In looking again at other technical indications, our Mid-Term Breadth index also managed to register a divergence against the recent new price high:
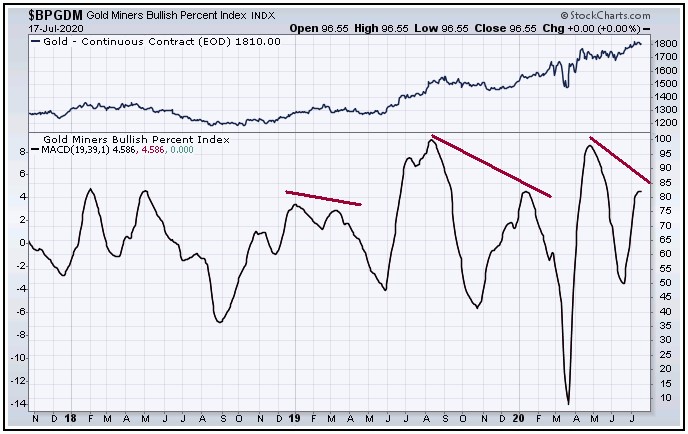
As can be seen on the chart above, divergences between our Mid-Term Breadth index and price are normally seen at or near tops in the gold market. Having said that, we use price 'reversal points' to actually confirm the turns with the cycles. With that, we have a key level that we are watching, which - if taken out to the downside at any point going forward - will confirm our 154-day wave to have turned lower for the coming weeks, with the precise details noted in our Gold Wave Trader report.
Stepping back, once the next peak is in place for the 154-day wave, then the odds will favor a good-percentage decline playing out in the weeks to follow, a move which is expected to end up as another countertrend affair - due to the larger bull market. In other words, the coming correction phase of the 154-day cycle should simply be that - a correction within an ongoing bull market. With that, it should look to be bought, in the anticipation of reaching up the 2000 figure or better met in the months to follow.
U.S. Stock Market
As mentioned in my last article, the closing action into July 8th ended up confirming a turn with our 45-day cycle, with that assessment looking for a minimum push to higher highs (above 3233.13 SPX CASH) for the larger swing - which we did see playing out with the action into last week. Here again is our 45-day component:
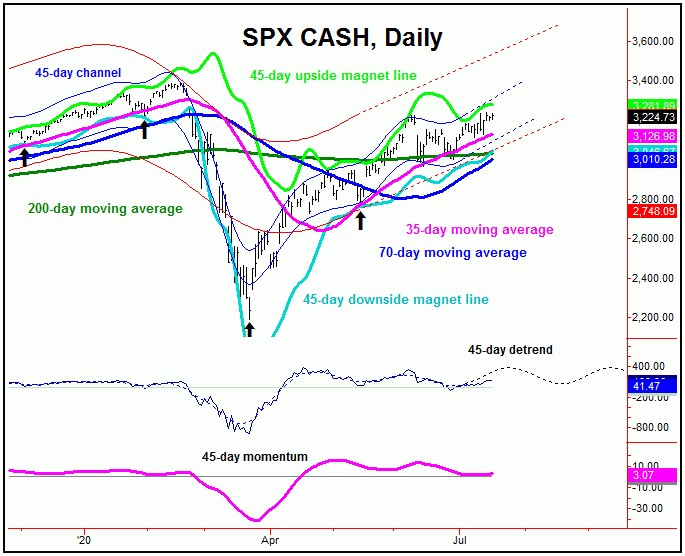
In terms of price, the ideal path has favored a move up to the 3260-3280's or better before this wave tops, though time is starting to run out on this scenario - with the wave now back in topping range. Once it does top out, we should see a decent decline playing out in the days/weeks to follow, a move which is expected to end up as another countertrend affair - holding above the prior 45-day trough of 2965.66 SPX CASH, seen back in June. If correct, higher highs should play out on the next swing up, where we will be looking for the next mid-term top with stocks to form.
The Bottom Line
The overall bottom line with the above is that both gold and the U.S. stock market are looking for a correction in the coming weeks, though these declines are anticipated to end up as countertrend - against the larger bull trend in each. If correct, higher highs should play out in the weeks/months to follow, before setting up the next mid-term peak for each market. Stay tuned.
Jim Curry
The Gold Wave Trader
http://goldwavetrader.com/
http://cyclewave.homestead.com/


