Gold Forecast: Gold Stocks Know Something Many Don’t


In our previous article, we told you about a shocking analogy in gold stocks and what it implies for the following months for gold and the rest of the precious metals sector. And you know what? As we dig deeper, the story got even more jaw-dropping. We’ll get to the details shortly. Beforehand, we’ll remind you what the shocking analogy was. If you already read our previous analysis, please feel free to skip the next several paragraphs. If you’re new to this topic – we hope you enjoy, and profit from it. Let’s start with the background information.
Gold price moves based on multiple drivers, and while some may say that it’s key price drivers are the USD Index and the real interest rates, that’s only partially true as it relates to the long term only. Ultimately, investors may choose to focus on many other things when buying or selling gold in the short run. Their choices might not be based on logical analysis at all – the decisions might be purely emotional.
Gold stocks, however, have a definite input that determines where their prices are heading. It’s… the price of gold. This should be surprising – after all, gold mining producers mine gold and sell it and while some of them engage in hedging, it’s not the standard practice for every company. Miners’ share prices depend on their profits, which in turn depend on their revenues, and revenues depend on the market price of the asset that the miners are selling – gold. What might be surprising is that there is a specific relationship that works in the opposite direction as well.
Quite often, gold miners tend to indicate where gold is going to move, by moving there first. In particular, the initial parts of major rallies should be confirmed by enormous strength in the gold mining sector. The early 2016 strength serves as example. The 2011 serves as a different example. Gold made new highs but gold stocks moved only a bit above their previous local high and then declined, erasing the previous gains. This weakness indicated THE top in gold and it preceded the massive declines in the following months and years. What does the gold stock performance predict for gold in the following months? That’s what we’ll discuss in the following part of today’s analysis. Let’s start with a quick note on the most recent performance.
Gold miners were in the rallying mode in October but all it took were only three days for the GDX ETF (the flagship ETF for the senior mining stocks) to move to a new monthly low and close at the lowest level since mid-July. But you know what? This is really, really boring compared to what we just discovered in gold miners’ long-term chart. In the previous weeks we discussed quite a few analogies, with the flagship one being the link between the current situation and what we saw in mid-90s. The long-term strength in the USD Index is likely to translate into much lower gold prices. The key takeaway of these analogies is that the decline to the final lows in the precious metals market has likely begun in August. The thing that we just discovered in the gold stock chart fits all this so well that we’re surprised that we haven’t seen it sooner. To our defense, we still saw it sooner than anyone else.
So… What would you say if we told you that the gold stock history is repeating with an almost exact 20-year delay? It might raise a few eyebrows and nothing more… Until you saw the chart that shows you how precise it is and how well it fits to what happened now and what happened in 2012 as well. On to the chart, then!
The Miners’ Analogy
(as a reminder, clicking on the below gold stock chart will expand it – we recommend opening it in a new window or tab for easier access)
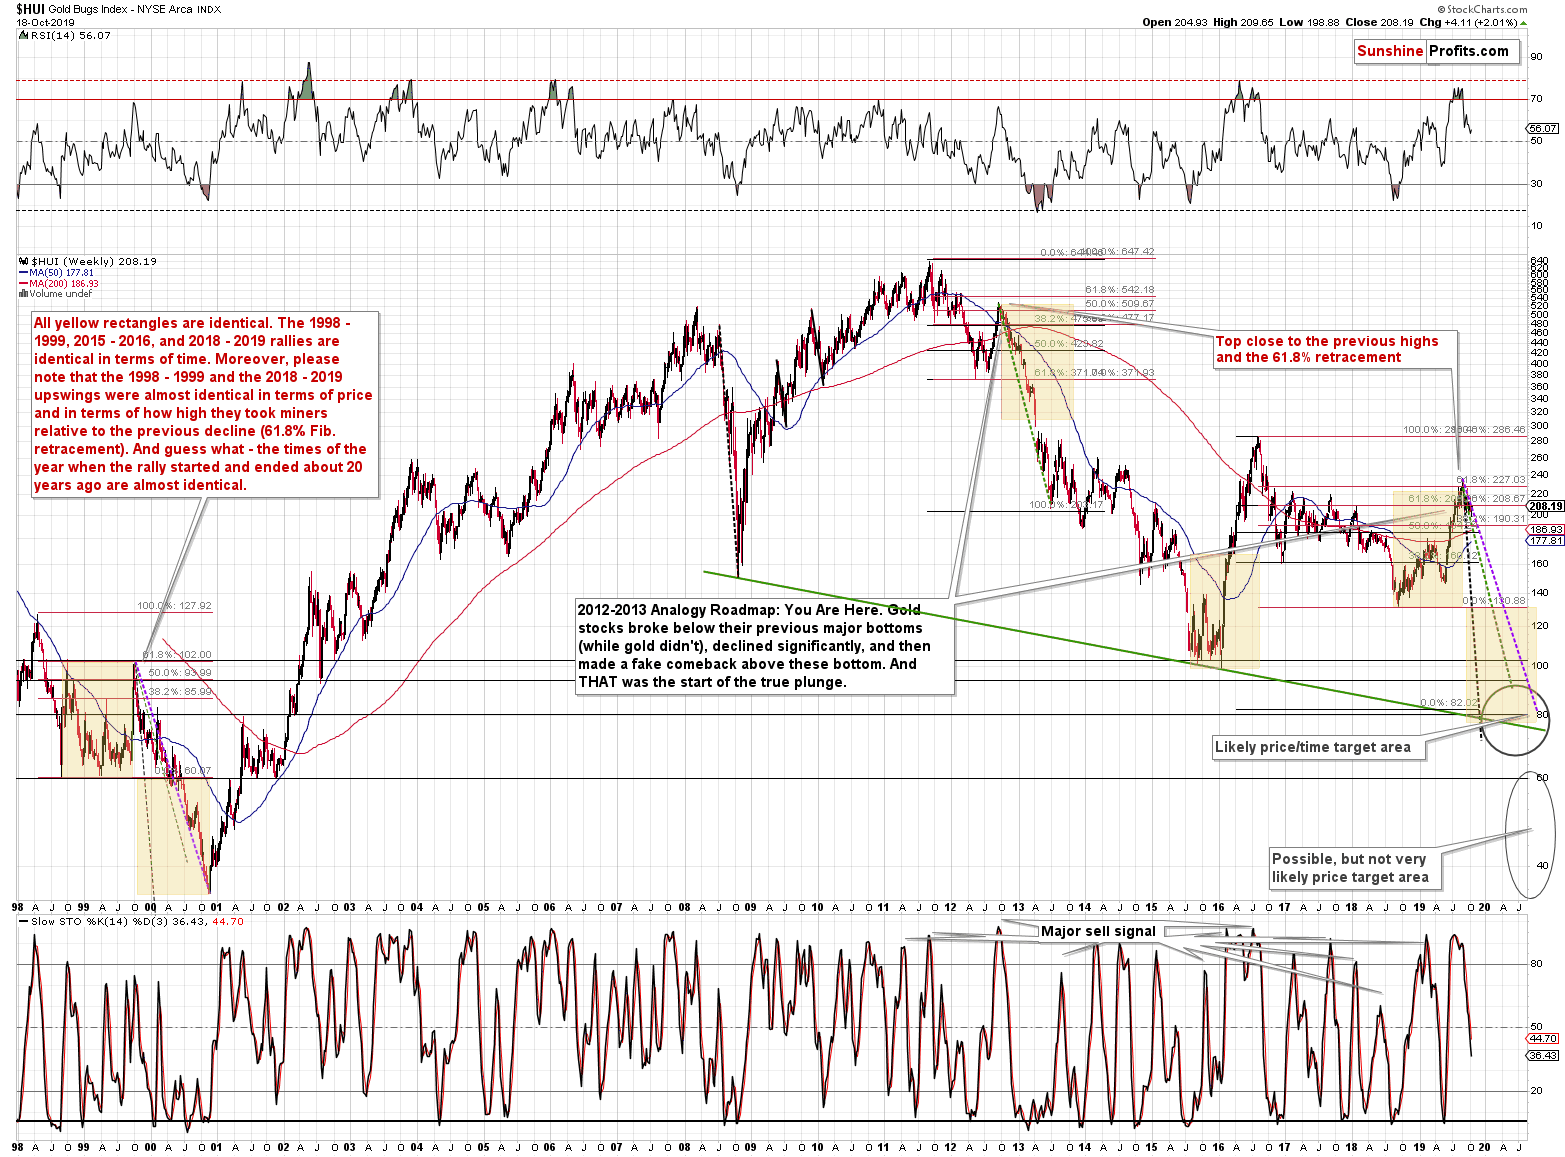
Let’s start with something relatively more familiar – the Fibonacci retracements. Back in 2012, the HUI Index retraced almost 61.8% of the preceding rally before the decline continued. That was one of the reasons that we thought that the 2019 rally won’t get much above this retracement, if at all. Indeed, the breakout above this retracement was very short-lived. However, this is not the only time when this retracement stopped a sizable, yet counter-trend rally before a big decline.
The 1999 top formed almost exactly at the 61.8% Fibonacci retracement. That’s one similarity between what happened recently and in 2012.
The second similarity is what’s so exciting about this discovery. The length of the rally. All yellow rectangles on the above chart are identical. The 1998 - 1999, 2015 - 2016, and 2018 - 2019 rallies are identical in terms of time. Most importantly, the 1998 - 1999 and the 2018 - 2019 upswings were almost identical in terms of both: time and price. And that’s in addition to both rallies ending at the same Fibonacci retracement.
Let’s re-state it again. Both rallies took practically the same amount of time, and the rallies were almost alike in terms of size – percentagewise.
But wait, there’s more!
The times of the year when the rally started and ended about 20 years ago are almost identical as well. The 1998 rally started right after the middle of the year and the same thing happened in 2018. The rally ended in the second part of 1999 and the same was the case right now. The month is not the same, but it’s so close that the gold stock seasonality might have influenced the prices in the similar way, which means that the follow-up action could be very similar.
Based on the way in which the previous bear market in gold stocks ended, it seems that we have about a year of lower prices ahead of us and the HUI Index will decline at or a bit below the 80 level. That's in perfect tune with the upper one of the price target areas that we've been featuring on the above chart for some time now. The key of the additional trading techniques pointing to the 80 level or its proximity as the downside target are the early 1999, and 2011 tops as well as the early 2002 bottom, and the long-term declining support line based on the 2008 and 2016 lows.
Now, what we want to add today is that there is one other important confirmation that tells us that the recent top was just like the 1999 top.
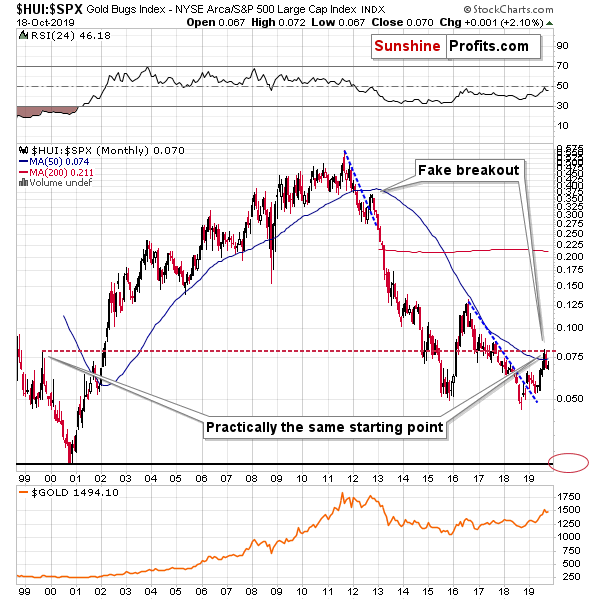
Dividing the value of the HUI Index by the value of the S&P 500 Index provides us with a ratio that shows us how miners are performing relative to other stocks. The interpretation is quite straightforward. During bull markets this ratio rallies and during bear market this ratio declines.
The ratio was on the rise between 2000 and 2011 and it’s been declining since 2011 with two notable corrective upswings. The one in 2016 was big, and the recent one was relatively small.
Now, what is so remarkable about the recent corrective upswing is that it ended at practically the same level, just where the 1999 corrective upswing had ended.
This is astonishing. Based on other analogies, that year was very similar to what we saw right now, and it turns out that relative to other stocks, both situations were practically identical. These rallies (the 1999 and 2018-2019 one) started from similar price levels too.
History tends to rhyme, which suggests that we should expect the HUI to S&P 500 ratio to decline severely in the following months. The target is at about 0.027. The S&P 500 is currently trading at about 3000, which means that the HUI Index could fall to about 0.027 x 3000 = 81. This level is in tune with the target that we described based on the HUI Index chart, which further validates this forecast.
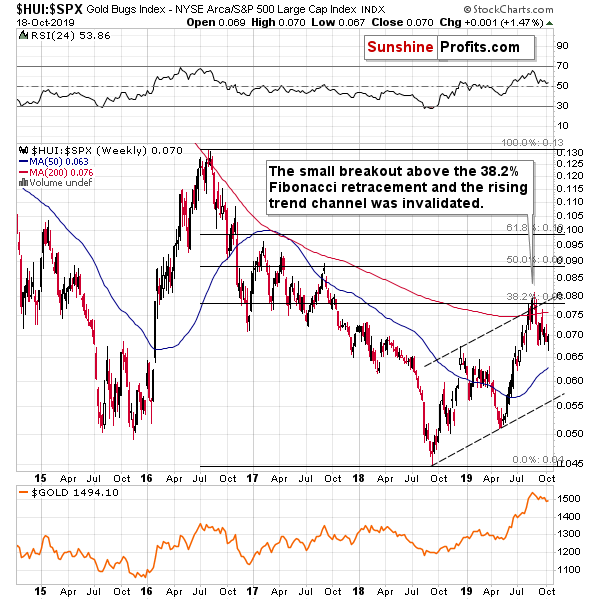
On a medium-term basis, the rally in the ratio seems to be over as well. The ratio moved a bit above its 38.2% Fibonacci retracement and the rising trend channel (dashed lines), but both small breakouts were invalidated, which acted as a strong sell signal. The ratio has been in the decline mode ever since.
There are short-term takeaways of the gold-stock analogy as well (when are the short-term counter-trend rallies take place), but leave them to our subscribers (this article is based on our Gold & Silver Trading Alerts). What we want to emphasize here is that the big decline in both: gold stocks and gold is still in its early days and quite a few months (perhaps about a year) remain until the final bottom might form.
Summary
Summing up, it seems that the corrective upswing in gold is over and that the yellow metal's big decline is already underway (and that it had started in August as we had written previously). The weak performance and breakdown of mining stocks confirms the bearish outlook. The similarity to how gold stocks rallied and then declined about 20 years ago provides us with a specific time target for the decline in the entire precious metals sector - it's likely to take place for about 1 year from now. That's not particularly close, but the road lower that gold, silver, and miners are likely to take is not short either. The profits from the short position in gold, silver and mining stocks are likely to be legendary, but the difficult part is not to miss the decline. Fortunately, the pace of decline that we saw 20 years ago provides suggestions regarding when it might be worth to bet on the corrective upswing with one's trading capital and when it's better to wait it out.
The following months are not likely to be pleasant times for anyone who refuses to jump on the bullish bandwagon just because prices moved higher in the previous months, but what’s profitable is rarely the thing that feels good initially. Forecasting gold’s rally without a bigger decline first is likely to be misleading. There will most likely be times when gold is trading well above the 2011 highs, but they are unlikely to be seen without being preceded by a sharp drop first.
Naturally, the above is up-to-date at the moment of publishing and the situation may – and is likely to – change in the future. If you’d like to receive follow-ups to the above analysis, we invite you to sign up to our gold newsletter. You’ll receive our articles for free and if you don’t like them, you can unsubscribe in just a few seconds. Sign up now.
Przemyslaw Radomski, CFA
Editor-in-chief, Gold & Silver Fund Manager
Sunshine Profits - Effective Investments through Diligence and Care
* * * * *
All essays, research and information found above represent analyses and opinions of Przemyslaw Radomski, CFA and Sunshine Profits' associates only. As such, it may prove wrong and be a subject to change without notice. Opinions and analyses were based on data available to authors of respective essays at the time of writing. Although the information provided above is based on careful research and sources that are believed to be accurate, Przemyslaw Radomski, CFA and his associates do not guarantee the accuracy or thoroughness of the data or information reported. The opinions published above are neither an offer nor a recommendation to purchase or sell any securities. Mr. Radomski is not a Registered Securities Advisor. By reading Przemyslaw Radomski's, CFA reports you fully agree that he will not be held responsible or liable for any decisions you make regarding any information provided in these reports. Investing, trading and speculation in any financial markets may involve high risk of loss. Przemyslaw Radomski, CFA, Sunshine Profits' employees and affiliates as well as members of their families may have a short or long position in any securities, including those mentioned in any of the reports or essays, and may make additional purchases and/or sales of those securities without notice.
 Przemyslaw Radomski, CFA, is the founder, owner and the main editor of SunshineProfits.com. You can reach Przemyslaw at: http://www.sunshineprofits.com/help/contact-us/.


