Gold Forecast: Gold's Current Cyclical Picture


 Recapping Last week
Gold saw its high for last week registered in Wednesday's session, here doing so with the tag of the 1850.30 figure (August, 2022 contract). From there, a decline was seen into late-day Friday, with the metal dropping down to a low of 1817.70 - before bouncing slightly off the same into the daily/weekly close.
Gold Market, Short-Term
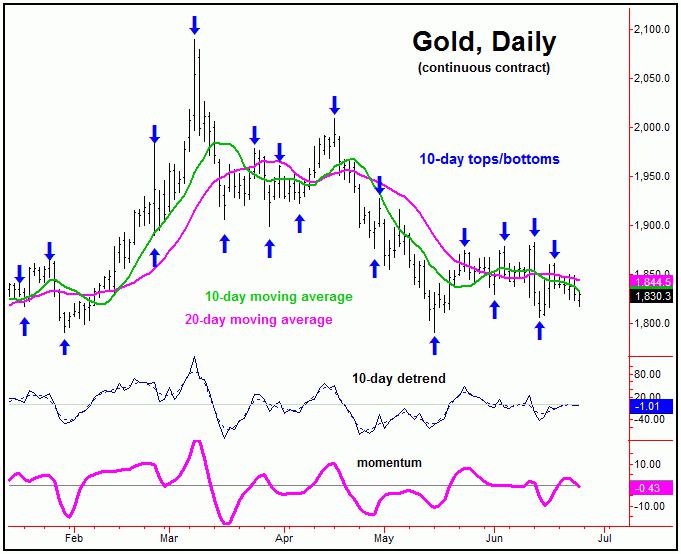
For the very short-term, the downward phase of at least the 10-day cycle is in force, with the same now at 8 trading days along from its last labeled low (6/14/22), with this wave shown on the chart below:
As for the larger 20-day component, there is the potential that the June 14th low will end up as the last bottom for this cycle, though this is still unclear - and would need to be confirmed. The chart below shows this 20-day cycle in the Gold market:
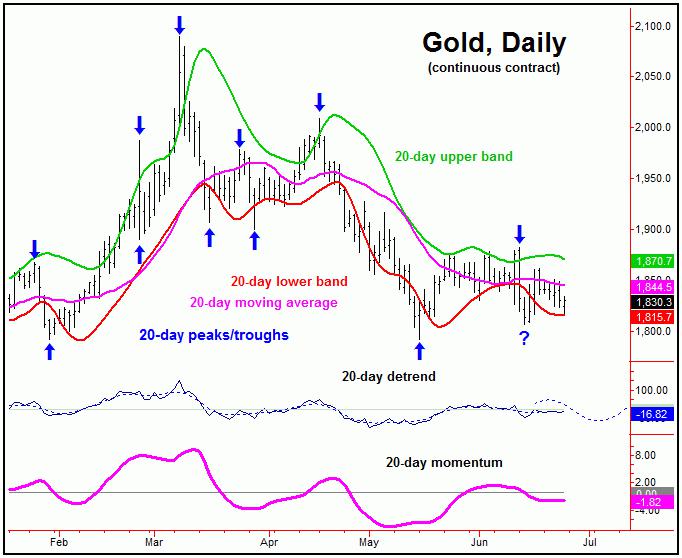
With the above said and noted, it would currently take a reversal back above the 1862.00 figure (August, 2022 contract) to actually confirm a turn back to the upside with the 10 and 20-day cycles, a number which could continue to drop going forward, depending on the action. Otherwise, below that figure will keep the metal in more of a bearish configuration for the short-term.
Gold's 3-6 Week View
Stepping back, until proven otherwise, the upward phase of the larger 72-day cycle is still deemed to be in force, with this wave shown again on our next chart:
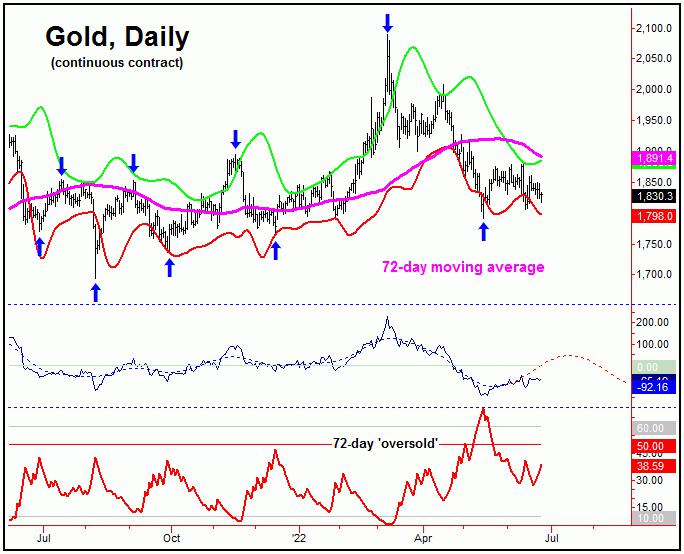
With the position of this 72-day cycle (i.e., higher into mid-July or later), the ideal path is looking for the current correction phase to end up as countertrend, holding above the 1791.20 swing low. If correct, the next upward phase of the 10 and 20-day cycles would be favored to push higher into mid-July or later, then to be on the lookout for the next key top to form - coming from this same 72-day component.
In terms of price, our minimum target for the upward phase of this 72-day cycle was the upper 45-day cycle band indicator, an action which has already been met with the June 13th tag of the 1882.50 figure. Having said that, the 72-day moving average will normally be hit on approximately 85% of the upward phases of this 72-day wave, and - if correct - since this has yet to be seen - the overall assumption is that it is still out there, ideally playing out following the completion of the current decline.
The Mid-Term Picture
Stepping back further, the next mid-term trough is expected to come from the larger 310-day cycle, which is shown on the next chart:
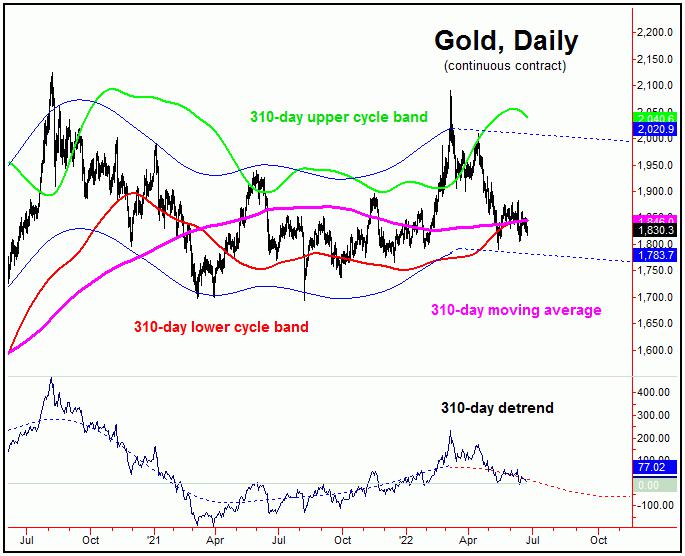
In terms of time, this 310-day cycle is next due to bottom around the month of October of this year, plus or minus. In terms of price, with the most recent correction with the smaller 72-day cycle, Gold has already made it back to the 310-day moving average - thus already having met any normal minimum assumption with this 310-day component.
Stepping back further, once the 310-day cycle does in fact bottom out, the odds will favor a rally of 20-25% or more playing out into what looks to be late-Spring of next year. This 20-25% range is what the average rallies have seen with the upward phase of this 310-day cycle. Having said that, it is too early to say what price figure will end up bottoming this wave, though we should have a better idea as we move along.
Jim Curry
The Gold Wave Trader
http://goldwavetrader.com/
http://cyclewave.homestead.com/
********


