Gold Forecast: It's Time To Buy


 Recapping Last week
Last week's trading saw Gold forming its high in Monday's session, here doing so with the tag of the 1885.60 figure. From there, a sharp decline was seen into late-week, with the metal dropping down to a Friday low of 1797.20 - before bouncing slightly off the same to end the week.
Gold Cycles, Short-Term
For the very short-term, the downward phase of the smaller 10 and 20-day cycles is currently deemed to be in force, though are into bottoming range. The chart below shows the smaller of these waves, the 10-day component:
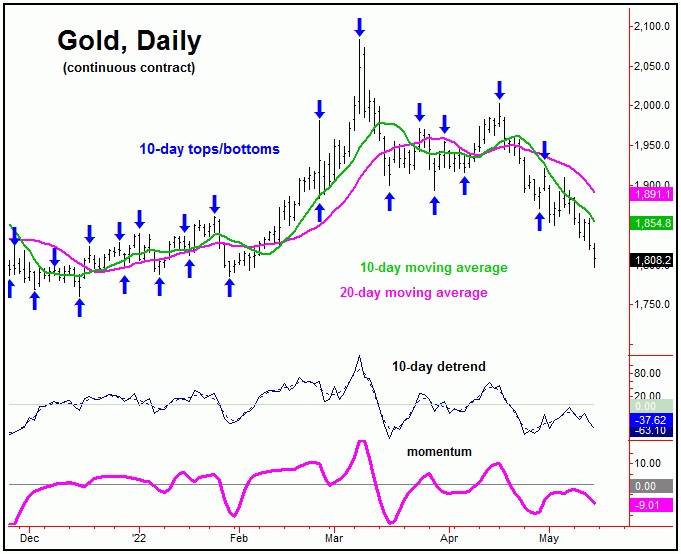
With the recent action, our current upside 'reversal point' for the 10 and 20-day waves is set at intraday push back above the 1865.00 figure (June, 2022 contract) - a number which could continue to drop going forward, depending on the action, with the most current numbers always posted in our Gold Wave Trader market report.
Stepping back slightly, from whatever bottom that is seen with the 10 and 20-day waves, the probabilities will favor a rally back to the 20-day moving average or better on their next short-term upward phase.
Gold's 72-Day Downward Phase Still in Force
Since the March peak of 2083.70, Gold has seen a drop of over 290 points into the low seen last week, with the metal now trading below its December, 2021 close of 1835.10. With that, anyone who has bought the metal this year (and still holding) is now at a loss. With that, there seems to be a complete lack of interest in the Gold market.
The lack of interest in Gold is a good sign, with the bullish case now starting to strengthen. That is, the next bottom of significance expected to come from Gold's 72-day cycle, which is shown again on the chart below:
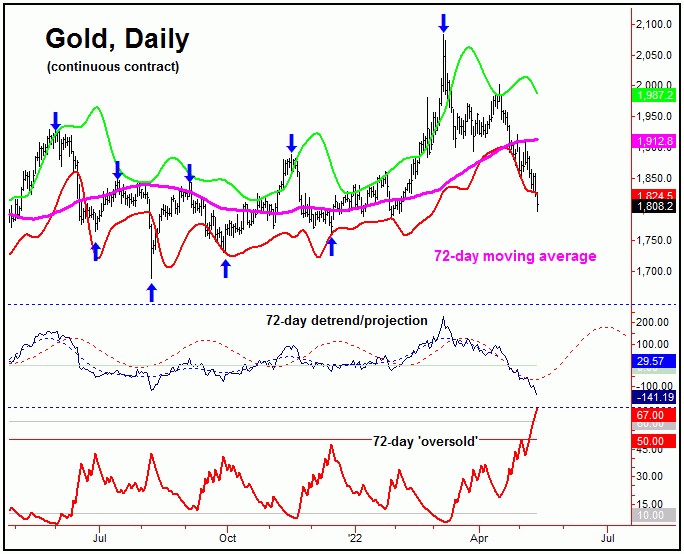
In terms of time, we are now into extended territory with this 72-day cycle. Once this 72-day wave does bottom, the average rallies with the same have been 14% off the low, lasting an average of 40 trading days before topping. With that, there is a ton of potential upside, once this wave does turn higher.
From last weekend: "in order for the next really good buy trigger to be seen with Gold, I would like to see our 72-day 'oversold' indicator (which moves inversely to price - similar to the VIX, vs. the U.S. stock market) spiking above its upper reference line - which the recent action has now seen. I would also like to see daily close below our lower 72-day cycle band indicator, with the combination of the above ideally seen on the same trading day. This particular pattern/setup is often seen near key lows with this 72-day cycle."
The one thing that we did finally see with the action into late last week was this: we now have a close below our lower 72-day cycle band, as well as a daily spike above our upper 72-day 'oversold' line. From the comments made in recent outlooks, this pattern is often seen at or near lows with this wave.
With our 72-day cycle at or into normal bottoming range, its next low is due to materialize at anytime. Even said, Gold needs to take out a key upside 'reversal point' for price - an exact number which we are watching closely in the days ahead, with precise details noted in our Gold Wave Trader report.
Gold, Mid-Term Picture
In terms of patterns, the overall assumption is that the current correction phase with the 72-day cycle will end up as a countertrend affair - holding above the December, 2021 trough of 1760. If correct, then the next upward phase of this wave is favored to take Gold back above the 2083 swing top (the prior 72-day peak) into what looks to be the July - August timeframe of this year.
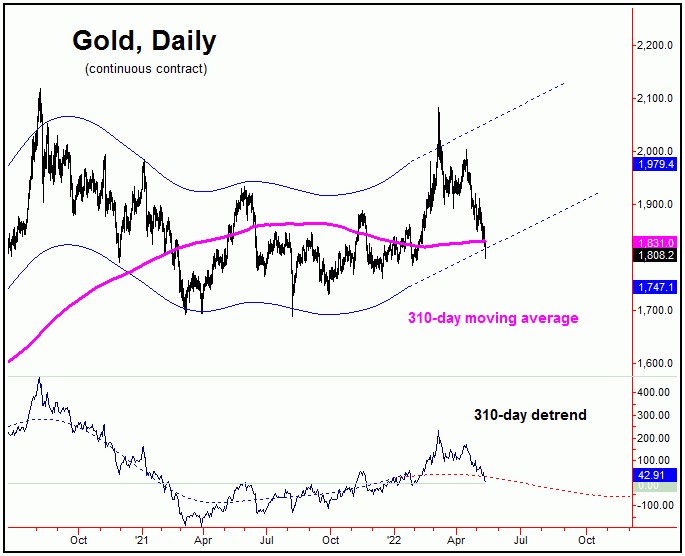
For the bigger picture, higher highs into mid-to-late Summer of this year - if seen - should eventually top our larger 310-day cycle (chart, above), for what is expected to be another good percentage decline into later in the year.
On the flip side, any break below that December, 2021 trough would tell us that our larger 310-day cycle has already topped - and would tell us to expect the next 72-day cycle upward phase to end up as only a countertrend affair. Note that either of the above scenarios favors a sharp rally soon playing out with the 72-day wave, with the new week expected to provide some key information. Stay tuned.
Jim Curry
The Gold Wave Trader
http://goldwavetrader.com/
http://cyclewave.homestead.com/
*******


