Gold Forecast: 'Kill Zone' Strikes Again


Last week's action saw the gold market forming its high in Monday's session, here doing so with the tag of the 1704.30 figure. From there, a monstrous decline was seen into late-week, with the metal dropping all the way down to a Friday low of 1504.00 - before bouncing slightly off the same to end the week. For the five-day period, the metal dropped $156 - a whopping net loss of 9.3% from the prior weekly close.
Short-Term Outlook
For the very short-term, the action has been dictated from the smallest wave that we track, the 10-day cycle, shown again on the chart below:
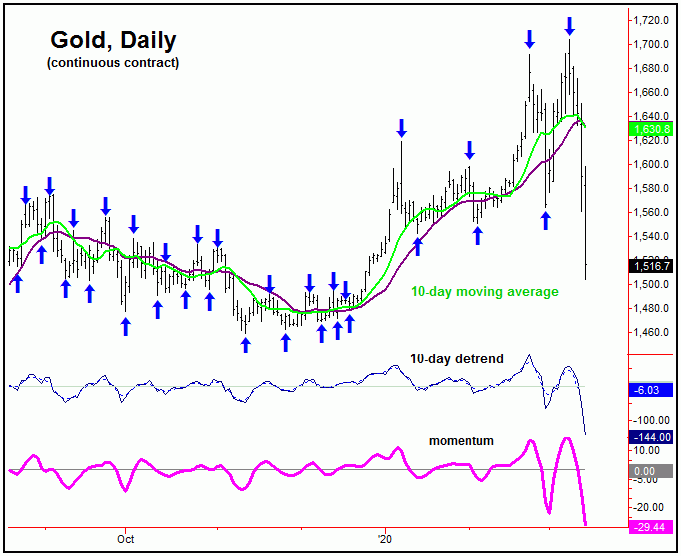
From my article posted last weekend: "In terms of time, we identified the March 6-9 timeframe as the ideal range for this rally to play out into - and to eventually conclude. With that, we are now looking for the next downward phase of this wave to assume control, which should put the 10-day moving average as the minimum magnet to price."
As mentioned above, the March 6-9 timeframe was the last projected topping range, which did play out as expected - with the high for the week made right on March 9th with the tag of the 1704.40 figure (April, 2020 contract). From there, our 10-day moving average minimum magnet was easily hit, though we noted the decent potential for additional weakness through the same.
With the above said and noted, the next short-term bottom should come from this same 10-day cycle, which is due to materialize at anytime, with more precise details noted in our thrice-weekly Gold Wave Trader market report. Once the downward phase of this wave is complete, then another rally back to the 10-day moving average is expected to materialize - though that move is favored to end up as countertrend.
'Kill Zone' and the 3-5 Week View
As pointed out in past weeks we had identified the late-February to early-March range as the kill zone to the recent rally. A 'kill zone' is identified as an approximate time/price conjunction, one which is expect to halt - and reverse - the prior move up.
Or, as the famous forecaster W.D. Gann once wrote: "when price and time meet, there will be a change in trend".
With that, last week's marginal push back to new highs for the move was expected to reverse back to the downside, once again due to the configuration of the 34 and 72-day time cycles that we track. Here again is the larger 72-day wave:
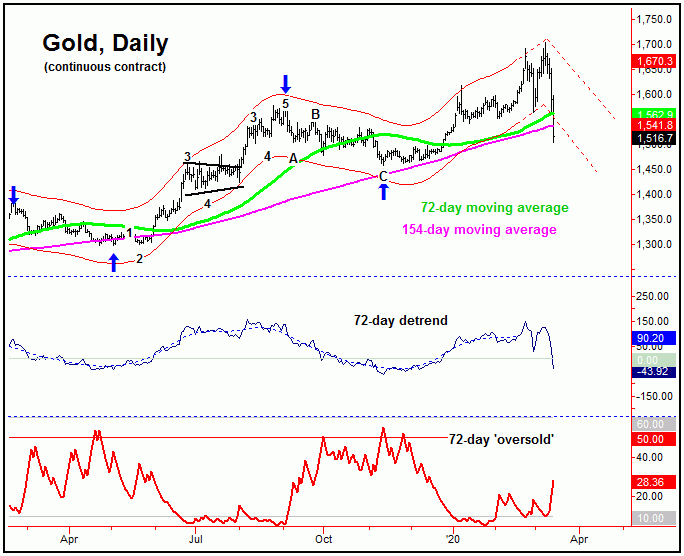
In terms of price, the overall expectation called for a bare-minimum decline back to the 72-day moving average - which we have now seen satisfied with the action into late last week. Literally nobody thought that gold would see the sharp decline that has played out in recent days, though it was predicted by the time cycle analysis.
With the above said and noted, we can say that our minimum price assumption has been satisfied in regards to this wave. Having said that, our 72-day 'oversold' indicator (red, on the lowest pane of the above chart) has barely budged, and I would like to see it move closer to its upper reference line in the coming days/weeks - something seen closer to troughs with this wave (note: this indicator moves inversely to price action, similar to the VIX does for the stock market).
In terms of patterns, as mentioned in prior articles, the overall assumption is that the current downward phase of the 34 and 72-day cycles will end up as an eventual countertrend affair, holding above the November, 2019 trough - the last labeled low for the larger 72-day component. If correct, then the probabilities will favor a push back above the 1704.30 swing top on the next upward phase of the 72-day wave.
In terms of time, we have a key 'reversal' date - which is where the next trough for this 72-day wave is likely to materialize, with the precise details noted in our Gold Wave Trader market report. For the bigger picture, from whatever low that forms with this wave, the strongest rally of the year is expected to play out into later in the year - with the 1800-2000 region or better acting as the eventual magnet.
Gold, The Long-Term View
For the bigger picture, the next larger-degree rally phase is the one expected to top the largest wave that we track for gold, the four-year cycle, shown below:
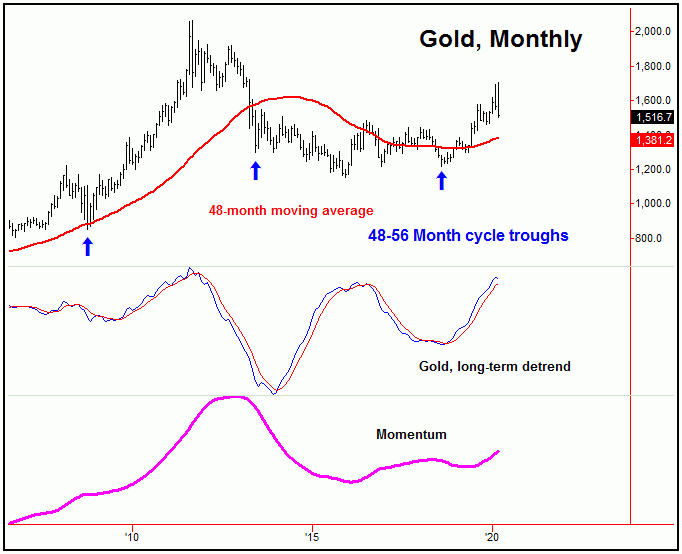
Until proven otherwise, the four-year cycle is deemed to be pointing higher into later this year, a move which should form the next major price peak for gold. From there, we will be on the lookout for technical indications of a top, which should give way to a very sharp decline into the late-2021 to Spring of 2022 timeframe, forming another longer-term bottom for the metal.
U.S. Stocks in (Countertrend) Rally Mode
As mentioned last weekend, the U.S. stock market was in a 'bottomless pit' - and was hit very hard, almost as hard as the gold market - with the SPX dropping over 8.8% for the week, and is now down nearly 16% for the year as a whole. Take a look at the next chart, which shows the most dominant mid-term cycle that we track:
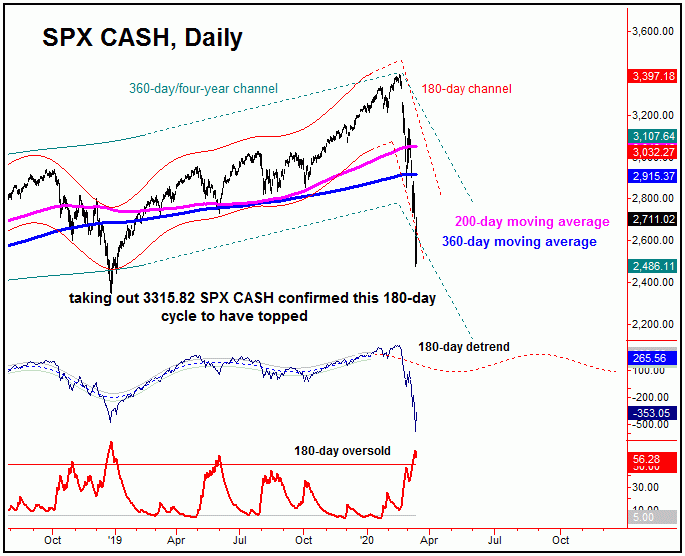
The chart above shows the 180-day cycle, which is next projected to bottom around the May or June timeframe of this year. In terms of price, as mentioned in prior weeks, the reversal below the 3315.82 SPX CASH figure (seen on 2/24/20) was the confirmation that the mid-term cycles had topped out with U.S. stocks - and with that were heading into their largest-percentage decline of the year. In terms of price, the 200-day moving average was expected to act as the minimum magnet, though with a decent potential that a decline back to the lower 360-day moving average would be seen.
With the above said and noted, the downward phase of this 180-day cycle remains in full force, though there is at least a bright light short-term, as we should be in the midst of a decent countertrend rally phase, due to the configuration of the smallest-tracked wave for U.S. stocks - the 10-day cycle, shown below:
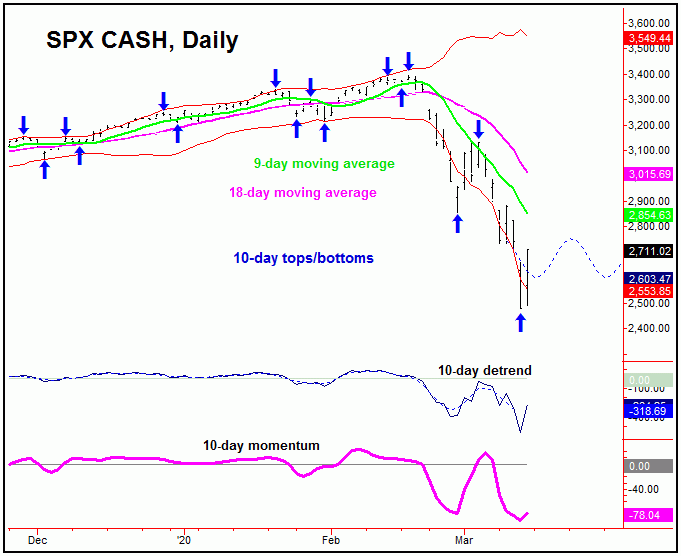
The 10-day cycle looks like it bottomed with Thursday's massive decline, and with that should be headed higher in the coming days - though we could be looking at another sharp decline at Monday's open. However, if the above assessment is correct, that decline will be met with buying, pushing the stock market higher for another week or two, with the 9-day moving average acting as the magnet here - and with some potential that a move as high as the 18-day moving average could be seen. Even said, this move up should be viewed as a countertrend affair, to be followed by lower lows, upon completion. More on all as we continue to move forward in the cyclic configuration.
Jim Curry
The Gold Wave Trader
http://goldwavetrader.com/
http://cyclewave.homestead.com/


