Gold Forecast - The Mirror Image Of The Bullish USD Forecast


The USD Index soared relentlessly in the previous months and it happened in the face of more and more bearish news that should have made it decline. The USD Index showed strength even in light of US President’s calls for zero or negative interest rates! Is there anything that the USD Index can’t do right now? When will USD’s rally finally end? And, most importantly for us – gold and silver investors – what would that signal for gold?
One of the best indicators for gold price is the USD Index. It can be used as a way to measure gold’s relative performance (strong performance despite USD’s rally might be bullish). It can also be used to detect the very long-term trends and to make gold predictions based on it. How? Simple – even though gold might move up or down, regardless of what the USD Index does in the short term, it’s near impossible for gold’s price to escape the impact of the currency in which it is priced. Soaring USD and constant demand from the non-US buyers would mean that they would we willing to pay less (more valuable) US dollars for the same amount of gold. Thus, gold’s price would decline.
Let’s start the USD discussion with the short-term changes and then zoom out to incorporate more details. In other words, we’ll start with trees and then move to the forest.
The USD Index moved in a volatile manner this week, but that’s not the most important thing about this market. The most important details are the price level that was reached during the intraday bottom, and how it relates to the previous lows.
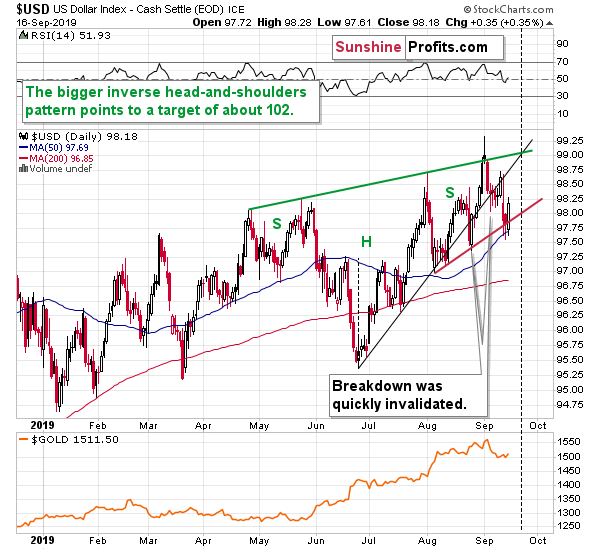
It was yet another higher low. The ultimate low this year formed in early January. Then, we saw a higher low in late January. Then a higher low in March, then a higher low in June, then a higher low in mid-July, then two higher lows in August and finally the higher low that we saw this week. Higher lows mean uptrend. The trendlines are useful to detect the turnarounds and the Fibonacci retracements tell us if the move in the opposite direction is significant enough to be viewed as a trend change. However, the underlying rule is simple. If the price is on average moving up, then the market is an uptrend. Looking at the relative placement of lows and highs tells us the same thing. By the way, the highs in the USD Index have also been increasing this year.
While the rising black support line was already broken, it didn’t cause the USDX to decline below the previous local low. It didn’t decline below the red line that’s based on the August lows either. And that’s despite Trump calling for zero percent rate policy or even negative interest rate policy.
In the previous Gold & Silver Trading Alerts we wrote that the market will be viewing the US President’s tweets and comments as less and less important, given how often Trump changes his mind (remember how quickly North Korean “fire and fury” threats turned into a handshake?). The higher USDX lows confirm that. It didn’t matter that Trump demanded radically lower interest rates. The currency traders didn’t care much.
What did all the above result in? We have the USD Index above 98, close to the yearly highs. It mostly doesn’t react to bearish news and it comes back stronger after each of such news is presented.
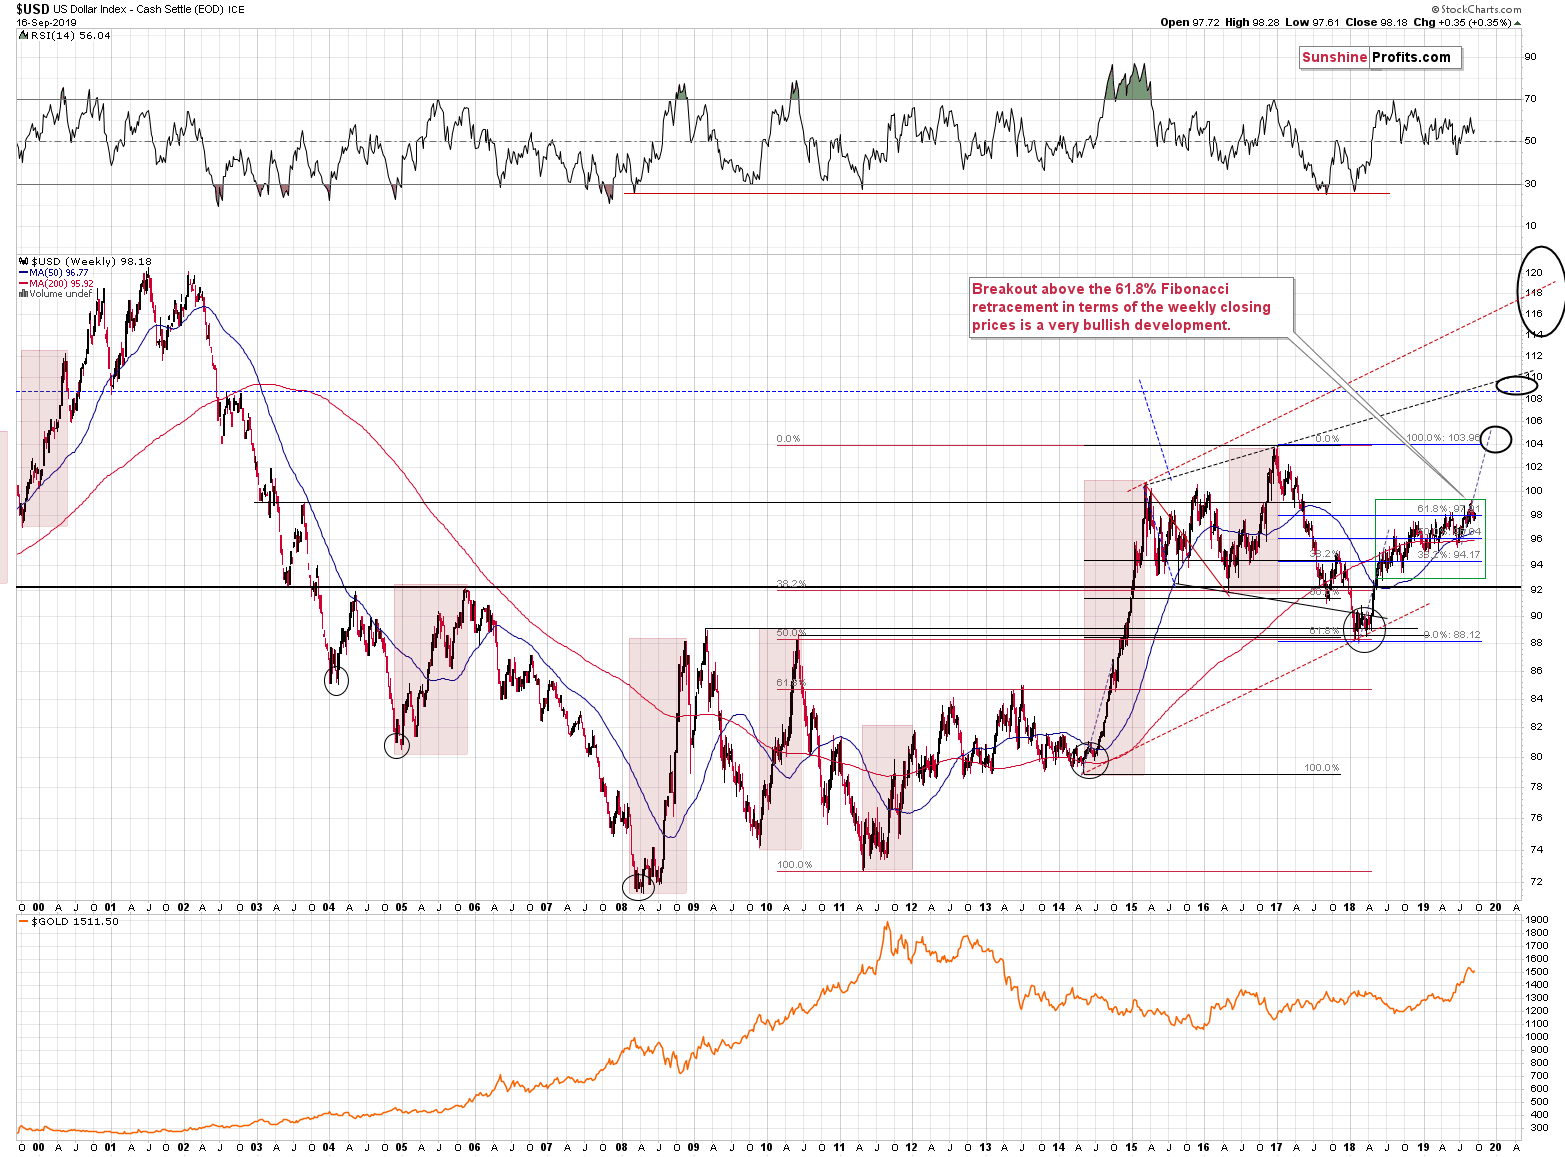
On the long-term chart it’s clear that it resulted in a prolonged, but “running” correction, where USD forms higher lows and higher highs – the most bullish form of correction. USD’s resilience to the negative news makes the breakout from the current consolidation very likely. Moreover, the USD Index managed to close the previous week above the May high (in weekly closing terms), thus verifying the breakout above it. It’s also above the 61.8% Fibonacci retracement based on the 2017 – 2018 decline, which means that it’s not just a corrective upswing that we’re looking at. It’s a new powerful rally.
Most importantly, however, the USD Index is after a long-term breakout above the declining resistance line and its verification.
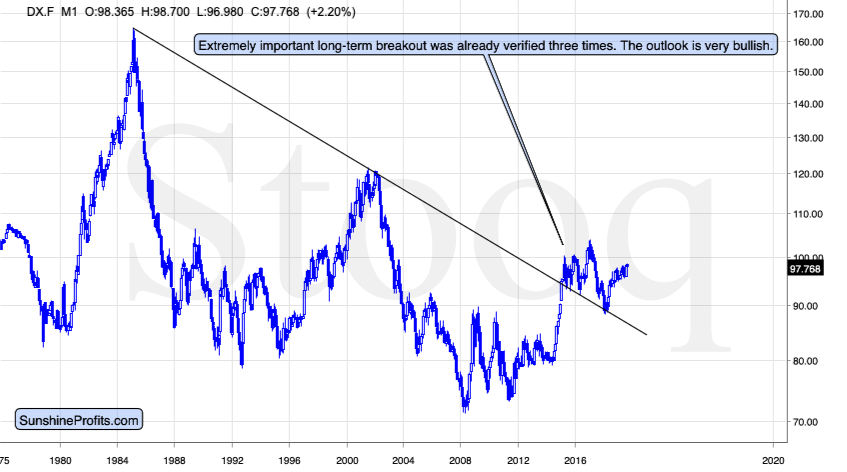
That’s one of the most bullish combinations of very long-term, long-term and short-term factors that a market can get.
The question that we received recently from one of our subscribers is how long the rally in the USDX might take. The short answer is that we would measure it in years, not in months. The details are not clear, though. The history tends to repeat itself but it doesn’t do so to the letter.
How long did the previous major rallies take? It depends on how one measures them. Is it the final bottom from which the rally starts, or is it the specific moment from which the USD Index takes off in a more volatile manner? It’s easier to use the former approach, but we think the latter is more appropriate. Why? Because if the price just moves back and forth but in a very slow uptrend, then it causes next to no emotional engagement from investors and traders. That’s why sharp rallies tend to burn out quicker than steady, boring uptrends. If we focus on the part of the rally that took place after the breakout was verified, we tap into this “emotional limit” and it should theoretically be comparable between the years. At least more than the rallies that would be measured from the exact bottom to the exact top.
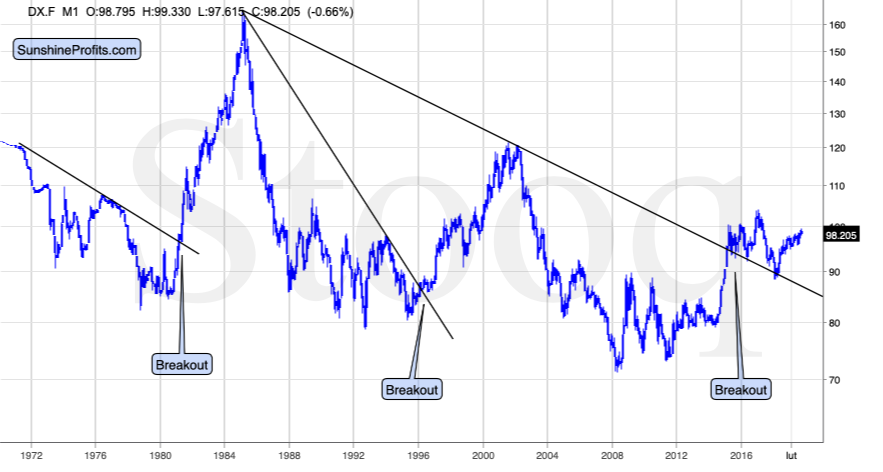
Let’s check the major bottoming and topping dates:
Bottom: October 1978
Breakout’s verification: April 1981
Top: February 1985
Difference between the bottom to top: 6 years and 4 months
Difference between the breakout and the top: 3 years and 10 months
Bottom: September 1992
Breakout’s verification: July 1996
Top: July 2001
Difference between the bottom to top: 8 years and 10 months
Difference between the breakout and the top: 4 years
Indeed, the time from the exact bottom to the exact top varied more than the time between breakouts’ verifications and the final tops. In fact, with only 2 months of difference, the latter was very much in tune. The average rally was 3 years and 11 months. The limit of this analysis is that we have just two comparable cases, but their alignment indicates that this technique could be quite useful.
Now, the recent breakout took place in 2015, but it was verified in February, 2018. Adding 3 years and 11 months to this time means that we should expect the USD Index’s rally to end close to the end of 2021.
Let’s see how the above fits the long-term USD chart.
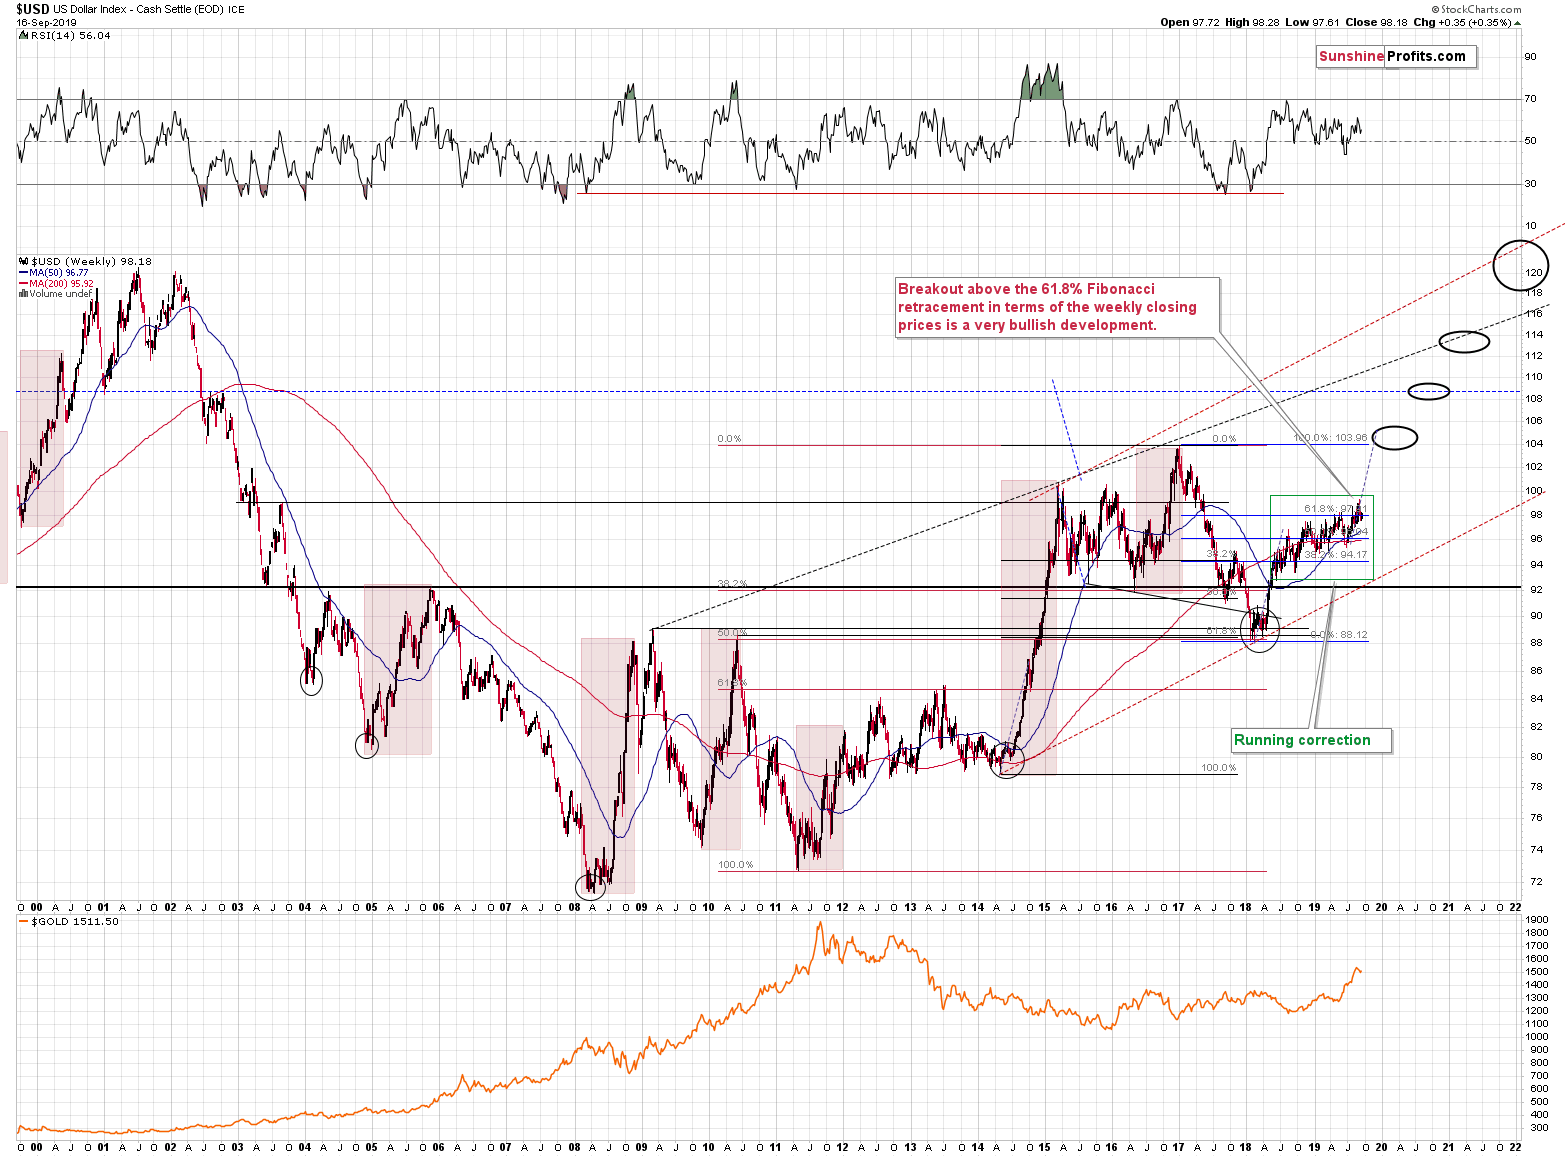
This prediction fits the technical picture very well. At the end of 2021, the USD Index could move to its all-time 2001 high, which was more or less when the precious metals sector bottomed.
Does it mean that gold, silver, and mining stocks will decline for more than 2 years?
It’s one of the possibilities, but not the most likely one. While the big trends are likely to be aligned, the bottoms and tops in the USDX and in gold don’t have to take place at exactly the same time. For instance, gold’s bottom in late 2015 took place before the USD’s top in early 2017 – about a year earlier. Gold’s, silver’s, and miners’ bottom might be one year away, even though the USD Index’s top might be over 2 years away. While we’re not saying that gold will bottom exactly one year from now, we are saying that it’s quite likely that gold will bottom before the USD tops. The current decline is much more than just a correction in gold despite the positive fundamental outlook, the CoT numbers, and gold manipulation theory. It’s a start of something much more profound.
Seeing how gold shows strength despite the rising USD will be one of the signs we will be looking for as confirmations of the epic buying opportunity in the precious metals sector. Of course, there are also other things that will need to be taken into account, like silver’s and miners’ performance. The latter is particularly important – for instance, the recent upswing in gold took place despite higher USD values, but silver and miners didn’t show similar kind of strength – they didn’t even manage to move above their 2016 highs. Consequently, the current situation is more like what we saw in mid-90s (start of the big decline) than what we saw in 2001 (start of the big rally).
As far as the short-term price changes are concerned, we have very little to comment on today.
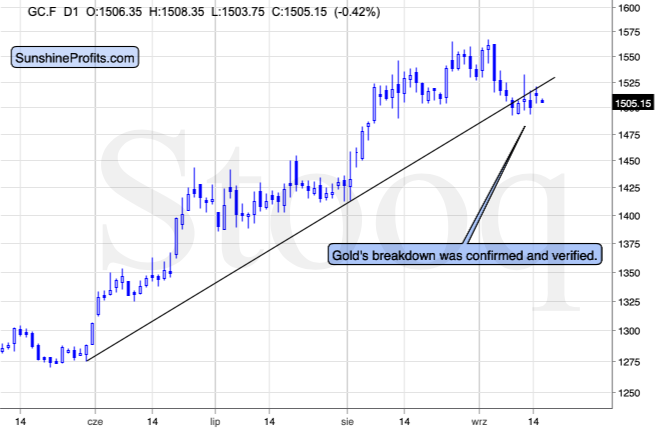
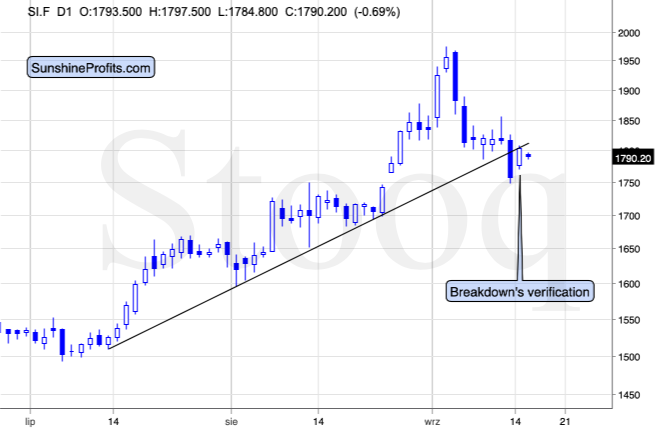
Gold and silver are verifying their breakdowns, which simply serves as a confirmation of the bearish factors that we see on the medium- and long-term charts. Day traders may want to think twice before opening any speculative long positions in gold and silver here.
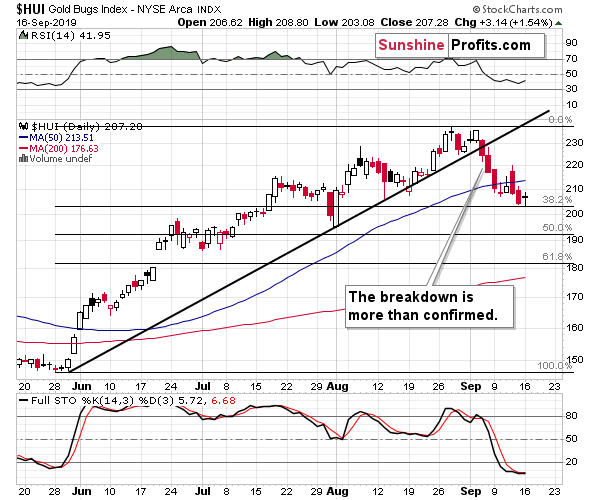
Moreover, even though gold’s yesterday’s upswing was relatively visible on a short-term basis, gold miners’ reaction was negligible. The HUI Index moved only a bit higher. Gold’s closing price that we saw yesterday was the highest closing price that we saw in 5 days. In case of gold miners, it was the second lowest closing price. The miners’ underperformance continues to point to lower precious metals prices in the following days and weeks.
Summary
Summing up, the big decline in the precious metals sector appears to be finally underway as gold and silver are plunging even without a rallying USD Index. Once the latter takes off, it will likely serve as fuel to the fire-like decline that’s already underway. Let’s keep in mind that taking the big investment picture into account, out of the following: gold, silver, gold stocks, silver stocks, the recent upswing was visible only in case of gold. Most of the precious metals portfolio: silver, gold miners, and silver miners suggest that what we saw in the last several months is nothing more than a corrective upswing within a bigger downtrend.
We know that these are not pleasant times for anyone who refuses to jump on the bullish bandwagon just because prices moved higher in the previous months, but what’s profitable is rarely the thing that feels good initially. In those circumstances, we simply cannot forecast silver or gold at higher prices in the medium term. There will most likely be times when gold is trading well above the 2011 highs, but they are unlikely to be seen without being preceded by a sharp drop first.
Naturally, the above is up-to-date at the moment of publishing and the situation may – and is likely to – change in the future. If you’d like to receive follow-ups to the above analysis, we invite you to sign up to our gold news letter. You’ll receive our articles for free and if you don’t like them, you can unsubscribe in just a few seconds. Sign up today.
Przemyslaw Radomski, CFA
Editor-in-chief, Gold & Silver Fund Manager
Sunshine Profits - Effective Investments through Diligence and Care
* * * * *
All essays, research and information found above represent analyses and opinions of Przemyslaw Radomski, CFA and Sunshine Profits' associates only. As such, it may prove wrong and be a subject to change without notice. Opinions and analyses were based on data available to authors of respective essays at the time of writing. Although the information provided above is based on careful research and sources that are believed to be accurate, Przemyslaw Radomski, CFA and his associates do not guarantee the accuracy or thoroughness of the data or information reported. The opinions published above are neither an offer nor a recommendation to purchase or sell any securities. Mr. Radomski is not a Registered Securities Advisor. By reading Przemyslaw Radomski's, CFA reports you fully agree that he will not be held responsible or liable for any decisions you make regarding any information provided in these reports. Investing, trading and speculation in any financial markets may involve high risk of loss. Przemyslaw Radomski, CFA, Sunshine Profits' employees and affiliates as well as members of their families may have a short or long position in any securities, including those mentioned in any of the reports or essays, and may make additional purchases and/or sales of those securities without notice.
 Przemyslaw Radomski, CFA, is the founder, owner and the main editor of SunshineProfits.com. You can reach Przemyslaw at: http://www.sunshineprofits.com/help/contact-us/.


