Gold Forms Bearish Double Top


The gold price saw some volatile price action today after hitting upside resistance and reversing back down impulsively. Let’s check out the daily and monthly charts and see the bearish pattern that has formed.
Gold Daily Chart
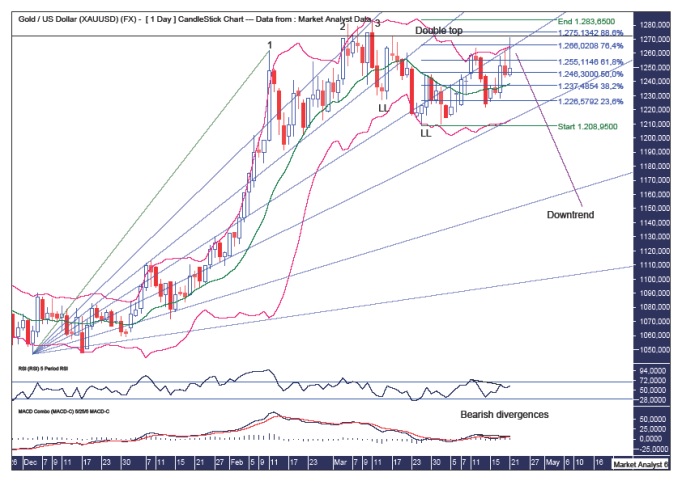
We can see price traded down from the recent high making two lower lows (LL). After the first lower low, price traded up to make a high at $1272 on the 17th March 2016. Since then price made a new lower low and then rallied all the way back up to today’s high at $1271 and before reversing back down immediately.
This has set up a double top with the 17th March high price which is denoted by the horizontal line. This is indeed a bearish formation as it is with the trend. By that I mean the trend is already down and this double top marks solid resistance.
What other signs are there that the daily trend is now down?
The Bollinger Bands show today’s high traded well above the upper band which is often found at solid tops.
I have added Fibonacci retracement levels of the move down from high to second lower low. The first rallies in a new bear trend often make deep retracements and this move up clipped the 76.4% level. Deep retracement? Check.
I have drawn a Fibonacci Fan from the December 2015 low to first spike high which was the first part of a “three strikes and you’re out” top formation. The final third strike high was right at resistance from the 23.6% angle. Price has subsequently been making its way through the angles with the recent move higher finding resistance from the 50% angle. It is possible that price has one last lash at this angle before the downtrend resumes with full effect.
The RSI and MACD indicators are both looking a bit weak with bearish divergences formed at this high.
So, a downtrend appears clearly in play on this daily chart. Let’s now go to the monthly chart to see what the bigger picture looks like.
Gold Monthly Chart
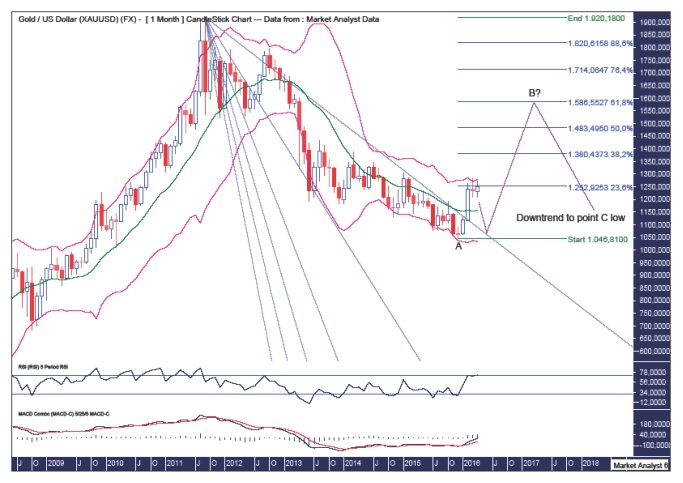
I believe a big bear rally is now in play which is a wave B of an ABC corrective formation.
This first leg higher looks to have found resistance at the upper Bollinger Bands, and I am now looking for a move back down to the lower band to set up a higher low.
I have drawn a Fibonacci fan from the all-time high to first lower low after that high. This first leg up of wave B and finally busted above the 88.6% angle which has proven solid resistance over the past year. I favour price now moving back down to test this angle which now represents support.
How high do I expect this wave B to trade?
I have added Fibonacci retracement levels of the move down from all time high to wave A low. I am targeting the 61.8% level at $1586 to bring in the wave B high. Interestingly, this is right around the level whereby the crash of 2013 commenced. During corrective phases, price often rallies back to these exact areas.
The RSI has finally been able to reach overbought levels which are generally bullish when looking at the big picture.
The MACD indicator is in bullish formation although the averages appear to have diverged a bit. A correction over the next couple of months would rectify that with the averages coming closer together. That’s likely when price would resume higher.
Once this big bear rally is complete then I expect the overall downtrend to resume which ends with a wave C low. In the previous analysis, I have forecast that low to be around the $600 mark. But let’s not fret about that just yet!
********
© 2014 Copyright The Voodoo Analyst - All Rights Reserved
Disclaimer: The above is a matter of opinion provided for general information purposes only and is not intended as investment advice. Information and analysis above are derived from sources and utilising methods believed to be reliable, but we cannot accept responsibility for any losses you may incur as a result of this analysis. Individuals should consult with their personal financial advisors. Put simply, it is JUST MY OPINION.


