Gold: The Good, The Bad, and The Ugly


 With the action seen into last week, Gold managed to spike back to higher highs for the swing, with the metal running all the way up to a Thursday peak of 2063.40 (June, 2023 contract) - before selling down sharply into Friday's session.
From the comments made in past articles, we are moving into the range for the next mid-term top for Gold, which does have some potential to have already formed. That peak has been expected to come from the combination of 72 and 310-day cycles that we track, with the smaller 72-day wave shown again on the chart below:
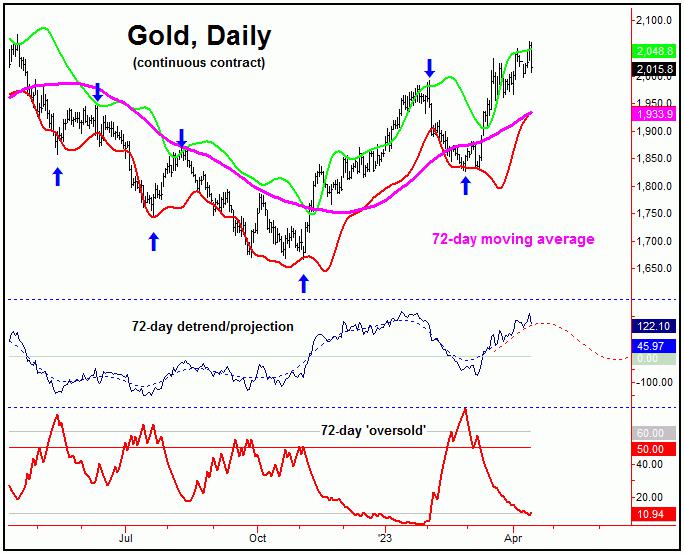
In terms of technical action, of note is that our 72-day 'oversold' indicator (lowest pane, in red) recently dropped back below its lower reference line. Since this indicator moves inverse to price action, a drop back below this lower line is something we expect to see near a price peak for this wave. Having said that, it is too early to say with confidence as to whether this wave has actually topped.
The Good News
In terms of price, a statistical analysis of the smaller 72-day wave has suggested the potential for a spike up to the 2080's or better (June, 2023 contract) before the next mid-term peak was made. With the spike up to the 2063.40 figure into last week, we are still short of this statistical inference.
With the above said and noted, there could still be a final spike back to a higher high before completing the upward phase of this 72-day wave, though this is not guaranteed. In terms of time, our original assessment favored higher highs into the late-April to mid-May timeframe; we will see how this develops.
Right now, it looks as if at least a 'momentum' peak has been seen with the high seen into last Thursday. With that, we are now awaiting confirmation of a bigger turn having occurred - by taking out a key price/reversal figure to the downside - with precise details noted in our Gold Wave Trader report.
The Bad
The bad news for Gold was mentioned in my prior article, which saw our Gold Timing Index forming a divergence against the new price highs, with this indicator shown again on the chart below:
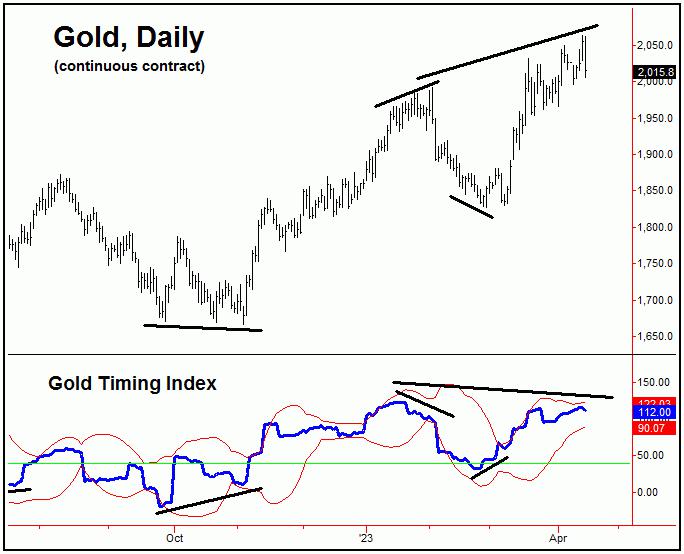
With the action seen into the recent new price high, our Gold Timing Index is still showing a slight divergence against its late-January peak, which is seen as a technical negative - and would be the best argument that a mid-term peak has already been seen for Gold.
Having said the above, the above divergence is small, and could be erased in the days ahead. There is no way to know for certain, other than to assess the action in real-time, as it continues to unfold.
At minimum, however, the above chart would tell you that the upside potential is likely limited for Gold, and the downside risk is much greater going forward.
It Could Get Ugly
As mentioned above, the good news is that Gold could make a try at a higher high (or some secondary high) in the next week or three. The bad news, as mentioned, is that there are technical signs that would support the idea of a mid-term peak already having formed.
The 'ugly' news is this: there is the potential for a decline of as much as 20% off the top in the coming months, due to the configuration of our larger 310-day wave, shown again on the chart below:
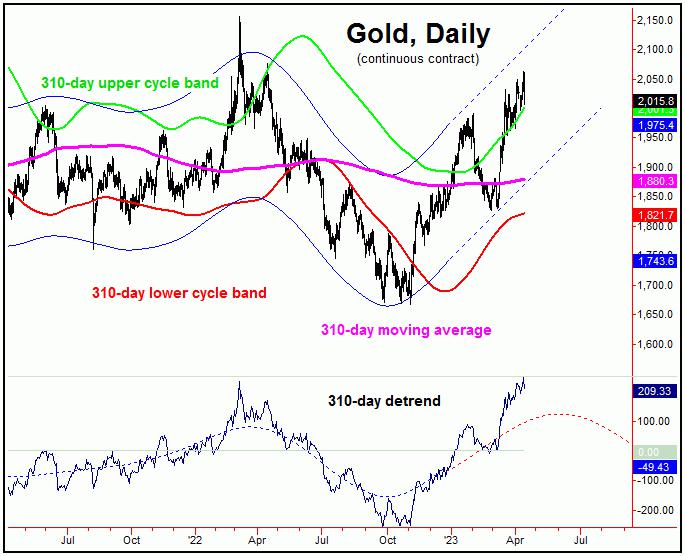
From the comments made in past months, our mid-term view called for strength into the Spring of this year - with that rally favored to be some 20% or more off the November, 2022 trough, the last low for this 310-day wave. That assessment has obviously been met, with Gold rallying some 23% off that November, 2022 bottom.
With the above said and noted, there is the downside risk to a decline of some 20% off the top for Gold, based on a statistical analysis of this wave. For a more recent example, the last peak for this 310-day wave witnessed a decline of 22% from peak-to-trough.
Having said the above, our ideal path is looking for the next downward phase of this 310-day cycle to remain above the November, 2022 low. If correct, a low seen later this year would be expected to give way to a sharp rally in the months to follow - ideally taking the metal back to new all-time highs for the bigger swing well into next year
Jim Curry
The Gold Wave Trader
http://goldwavetrader.com/
http://cyclewave.homestead.com/
**********


