Gold: Greenback Emissions


The mounting global warming and the pandemic have contributed to full blown energy and food supply chain disruptions hitting households and manufacturers keeping prices buoyant. Demand for oil, coal and natural gas have skyrocketed as energy prices reached record highs amid supply bottlenecks and rebounding demand for electricity sparked by shifts to combat climate change. Also, the surge in prices was fueled by under investment, and geopolitics resulting in squeezed energy supplies and a reminder of our addiction to cheap energy. At the root of the problem is that fossil fuels accounts for 84 percent of our global energy demand, unchanged from 1980 which jars with the global effort to fight climate change.
The UK energy crisis, Texas’ power woes in February and power rationing in China are demonstrations of climate change, as the globe faces another energy crunch perpetuated not by OPEC, but by the shift from fossil fuels. The problem is our reliance on gas and coal for electricity and since renewables are only a small percentage of our energy consumption, they cannot yet fill the gap left by the shift from fossil fuel usage. Electricity shortages forced energy-intensive steel, cement and aluminium producers to shutdown. While fossil fuels to date have filled the capacity gap, more stringent climate change rules risk further disruptions. Because solar and wind are consumed as they are generated, unlike fossil fuel which is plentiful and easily stored, renewable storage capacity remains a problem because the technology does not yet exist on the scale required or at an economical cost. Until then we will remain in the dark.
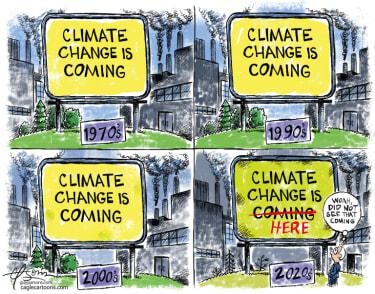
Climate Change is Coming, Coming
At the COP 26 climate summit in Glasgow, to prevent a warming planet, the cost of the global effort to reduce greenhouse gas emissions has escalated with developed nations contemplating using tariffs on trade to reduce emissions, even trumping energy security and reliability. The tariffs on the heels of the Trump tariffs and the European cap and trade system are regressive and importantly rewrite the rules of world trade, further dividing the world into the “haves” and “have nots”. It is not the silver bullet. Others hope to get financial institutions to foot the bill. While the COP26 climate pledges underwhelm, the social and financial damage is real. We might be driving electric cars but how are we to power up, if electricity is rationed? Our energy consumption is expected to increase by 50 percent by 2050, who and how are we to pay for this? The stakes are high.
Crude oil prices have climbed above $80 a barrel to the highest levels in seven years due to a lack of investment and tightening climate policies leaving the industry unable to meet demand. Natural gas is the ballast of the UK energy grid with almost 50 percent of UK power derived from natural gas, against 21 percent from wind and 2 percent from solar. North Sea oil has been on a slide for two decades, producing only one third of its 99 peak, and despite the ramp up in spending on renewables, capacity is insufficient to fill the demand gap, leading to the Grinch that stole Christmas.
Despite the clamor for cleaner energy, the green era has laid bare major deficiencies. Around the world for example, the demand for coal has outpaced supplies. Although coal is the biggest single source of greenhouse gases, coal powers two thirds of China’s energy grid. To boost cleaner energy, China imposed coal shutdowns but higher coal prices resulted in an energy crisis that shut down more then half of China’s provinces’ power, hobbling industry and leaving some homes without electricity. China’s problems were also exacerbated by a political spat with Australia that resulted in a cutback of coal imports which once provided 20 percent of China’s requirements. Newcastle coal prices have tripled since 2019. Global coal production meantime fell by 5 percent last year leading to higher prices, particularly since coal mines in the United States, Spain and Asia were closed to meet emission targets.
Mr. Biden’s focus on China’s absence in Glasgow made headlines. Noteworthy was that China, US and India together account for 70 percent of the world’s coal consumption were among the holdouts on the COP26 pact. Much was also made of China being the world’s greatest emitter of greenhouse gases, however, on a per capita basis, the story is different. The United States is actually the world’s leading emitter at 15.5 tonnes per capita, followed by China at 7.4 tonnes and India at 1.9 tonnes. The rest of the world? The average is 4.8 tonnes. So, who is the world’s number one polluter? The challenges are structural and there is no easy fix. Despite the goals of COP26, climate change is everyone’s problem but no one seems to have a solution.
Inflation is Everywhere
At COP26, attended by 200 world leaders, regulators, investors and protesters, most evident was the wide gap between pledges and the required near term reduction in emissions. As Queen Elizabeth put it, “they talk, but they don’t do”. While focus was on the non-binding “net zero” pledges, there was less on the technological problems, energy alternatives and importantly little discussion of the cost of these pledges or the broken promises or the global energy shortage. Importantly, global emissions will not drop if demand for fossil fuels does not decline.
The International Energy Agency (IEA) estimates that $4 trillion a year will be needed by 2030 to keep global emissions in check. However, in today’s culture wars, climate change like vaccines has evolved from a scientific issue to a polarization of political and economic interests. A green war has begun. Green battles are no longer fought in the streets but in the boardrooms and legislatures. Like all wars it will be inflationary.
The vulnerability of supply chains where a broken link causes chaos is all to common today and of concern, fueling a retreat from globalization. That broken link for some was the pandemic, but other causes such as government ineptitude, US polarisation, protectionism, and now climate change will mean that consumers will have fewer voices and will have to pay more for everything while inflation is back. The once hidden cost of environmental, social and government (ESG) is now visible with green infrastructure spending sparking more demand for commodities, from copper to lithium to oil.
Companies are buying carbon offsets to achieve “net zero” emissions. In principle each offset represents a tonne of carbon that has been removed from the atmosphere. Yet this “greenwashing”, however is a patchwork system and even the measurement is fluid, at best. Trading so far is often an ad-hoc basis with purchases voluntary, that both is non-controversial because it penalizes neither coal or oil and is strictly to boost green credentials. All this points to the dilemma of how to finance climate change, since consumers are already balking at higher fuel prices.
Déjà vu
The bottlenecks are a reflection that demand is much stronger than supply. Today’s surging inflation is driven by supply chain disruptions and the pandemic lockdowns, which has led to pressures on the Fed to limit its pump priming. The current situation presents many parallels with the 1970s. In the Seventies inflation averaged 7.5 percent topping at 15 percent. Today inflation hit a 31 year high in October as prices jumped 6.2 percent, growing for the sixth month in a row. Like then, monetary conditions remain loose with ultralow interest rates and cheap money. A major difference in the two eras however is that “greening of the economy” is a new inflationary force.
This time inflation has risen fueled by pandemic stimuli and cheap money.US gross domestic product is forecast at near 6 percent and prices at 6 percent. Rapid growth and tight supplies equal inflation. In the 1970s, the energy crisis was caused by two OPEC oil shocks and the disappearance of anchovies off the coast of Peru. Like then, today we also have an energy shock. The roots of the Great Inflation stretched back to Lyndon B. Johnson’s “Guns and Butter” policies in the Sixties and the two oil shocks. Similarly, the pandemic spending and Joe Biden’s social spending are more like the Johnson’s “Butter” policies, and like then too, the mounting energy crisis is spilling over into other sectors with higher wage demands, rising prices and inflationary expectations. Food prices have tripled pushing up the demand for substitutes, in a 1970s style food price crisis. Instead of missing anchovies, we have container ships idling outside the biggest ports in the US. In the 1970s, Fed Chairman Arthur Burns was reluctant to take the punch bowl away, tolerating rising inflation as a way to boost low unemployment. However, when inflation soared into double digits and oil prices soared, drastic monetary tightening was needed with double-digit interest rates by Paul Volcker to bring down inflation. Similarly, Fed Chair Powell is pleading for more time and despite having second thoughts about transitory inflation, he is reluctant to tighten amid concerns about unemployment. Like before, the Fed risks overheating the economy and the government continues to add monetary fuel by more spending, more entitlements and more debt. Déjà vu.
Greenflation
Inflation erodes the purchasing power of currency but lightens the government’s debt load – it is always a monetary phenomenon, a lesson often forgotten. As we learned at COP26, governments need more than lip service to fight emissions and inflation. Governments have already renamed inflation which has become more of our daily conversation. Today we have “transitory price increases”. Tomorrow, they might call it “elevated prices”. Inflation hit its highest level in more than three decades. It is neither transitory nor elevated. It is here to stay.
The last supercycle was driven by the rapid industrialization of China. Ominously a new La Nina climate development in the Pacific threatens, drawing similarities with the missing anchovies in the 1970s when food prices boosted households’ expectations of inflation. Today, structural change, some caused by Trump’s tariff war has curtailed production, contributing to lower inventories and bottlenecks. Higher energy prices have also fed through into the production of food and many goods. The UN’s Food and Agriculture Agency said that world food prices rose for a third consecutive month in October to reach a 10-year peak. On a year-on-year basis, prices are up 32 percent in October. The inflationary consequences of higher prices are weighing on global food supply chains as agricultural commodity prices spiked because of harvest setbacks. Benchmark wheat in Chicago climbed above $8 a bushel for the first time in nine years suggesting higher food prices at the supermarket. After hovering about $1.00 per pound, coffee futures reached highs not seen since 2014 topping $1.90 per pound.
Wage pressures from the government support plans kept many workers at home, resulting in a competition for workers and pushing up wages. Many baby boomers took early retirement during the pandemic, contributing to the labour shortage. Persistent labour shortages are prevalent, another source of inflation. Yet, at a time when there is a need for more than 10 million jobs, somehow 4.5 million workers are “missing” as the participation rate dropped at the fastest pace since World War II. We believe that the various government support schemes to pay locked down people not to work have skewed the labour numbers and emboldened by labour shortages and rising prices, employers are lifting wages, adding to the inflationary pressures. To date, a lot of the cash went towards home purchases of furniture, Pelotons and used cars. Some workers are holding out for higher pay as wages ratchet up to entice workers back. Others are sitting at home cushioned by Covid cash from the various government benefit schemes that both cushioned savings and provided for some, above average minimum income. In Britain, some immigrants who once provided a source of low wage jobs were sent home or blocked from returning to their jobs because of pandemic restrictions and/or Brexit.
Commodities too have been caught in a crunch traced back to the aftermath of the financial crisis. After years of neglect, the electrification of the green industry has led to a surge in metals like copper, nickel and cobalt used in batteries. Car makers face a potential shortage of aluminum, steel and zinc owing to depleted inventories. The problem with the “transitory” arguments advanced by economists and Mr. Powell is that they ignore the rolling impact of revived demand meeting inadequate supplies, which ensured supply shocks more like the Seventies experience when higher price expectations led to higher demand. First, semiconductor chips, now China has cut magnesium production to save power, resulting in a five-fold increase in prices. Magnesium is a vital component of aluminum alloys used in the production of cars and packaging. Since China provides 87 percent of global supplies, the stoppage has hurt car makers around the world amid fears of a shortage, costing the industry millions of lost vehicle sales and comes at a time when the automotive sector was expecting a recovery from the pandemic.
Greenback Emissions
The United States is a leader in spewing out greenback emissions with $6 trillion of fiscal pandemic stimulus that drove consumer spending 9 percent above pre-pandemic levels, leading to the supply bottlenecks that helped push up inflation. The mistake has its roots in the 2008 financial crisis, the worst economic disaster since the Great Depression, when the Fed saved Wall Street by printing increasing amounts of money into the system. Every year since then the United States prints more and spends more, emitting dollars.
The pandemic spending itself has resulted in bigger deficits at more than 13 percent of GDP, which is nothing new, since the last real budget surplus was in 1960. Again, governments protected household and businesses by printing money. But deficits aren’t forever. They must be financed. Today, US debt stands at $28 trillion or 120 percent of GDP and within 5 years will exceed $40 trillion or more than double America’s GDP. That gargantuan debt is high enough but the interest cost today is around $500 billion. With inflation moving up, and the prospects of higher rates, what is the interest bill on $40 trillion of debt? In dollar terms, we are in unchartered territory. We have record spending, at a record pace and record twin deficits.
America’s profligacy is financed by the $22 trillion Treasury market, which is a platform and thus a benchmark for much of the world’s interest rates. To avoid the pandemic collapse, central banks racked up staggering levels of debt or “nationalised” their economies, financed mostly by their balance sheets at almost 60 percent of gross national product. The era of central bank largesse has distorted the capital markets, putting further pressure on an already strained system. And President Biden’s pared down recovery plan, if passed will add $4 trillion to the Fed’s $9 trillion balance sheet. Policymakers at COP26 hope that the capital markets will finance decarbonisation but capital rivalry will leave the debt for future generations and beyond. That is unsustainable.
Although the Fed’s $120 billion a month is to be wound up, the market fears the Fed’s withdrawal because the big hedge funds often took the opposite side what was once a one-way trade. Already there have been major losses in the bond market. US traders were caught wrongfooted. Soon, Wall Street’s primary dealers and high frequency traders (HFTs) will have to deal with each other without liquidity of the Fed’s monthly purchases, ending the “one-way” bet trade. Dealers would again have to utilize their own balance sheets, trading acumen and algo models. The primary dealers might even have to return to their original roles as marketmakers competing with the high frequency funds and hedge funds. The bigger question, can the resumption of the marketplace both provide the financing platform and the financial balance sheet needed to finance America’s rising $28 trillion debt load? Already with clogged financial plumbing, the Fed’s emergency reverse repo facility hit $1.6 trillion overnight, as the world’s most liquid market turned illiquid.
One consequence is that any increase in federal debt is financed in borrowings, from a country’s own citizens or from foreigners. The US with a reserve currency has been able to borrow from foreigners and its citizens, printing money through quantitative easing (QE) or MMT schemes started after the 2008 financial crisis. The United States is on a debt treadmill and there appears to be no slowing down of the greenback emissions. Inflation has exceeded the Fed’s target. Money supply grew 35 percent. The Fed is not concerned.
In the past four decades, cycles peaked and recessions began when monetary policy was tightened to tackle inflation. As mentioned in the 1970s and 1980s, when inflation spiked into double digits, then Fed Chairman Paul Volcker undertook to crush inflation with double digit interest rates when 10-year Treasuries yields peaked at 16 percent. Today, policymakers are hoping to kick the can down the road with an easy-money policy encouraging ever increasing flows to the riskiest bubble-like markets (crypto $3 trillion).
In 2008, the boom became a bust but a combination of printing and borrowings saved the day. However, given the monstruous debt load of today, it’s unlikely that more greenback emissions can save the day as the lethal combination of rising inflation and financial instability ensures that central banks cannot take the punch bowl away without destroying the economy.
Capital Wars
The real problem is that America’s profligacy is an effective machine for undermining the economic power of the West. In addition, escalating antagonism between the world’s two superpowers is likely to hinder global cooperation on everything from climate change to trade to technology. China, the world’s top trading partner with a market ranking second only to the United States, is making the renminbi an international currency as part of developing the necessary financial infrastructure to reduce its dependence on the dollar, even going ahead with a digital renminbi payments system ahead of America. China is already the financier to the world with its “Belt and Road Initiative”, financing a good part of the East, turning China from an exporter of goods to an exporter of capital.
Carbon emissions have caused climate change and to be sure will affect our day-to-day lives and capital markets. We also believe that America’s record greenback emissions will not only sink the dollar but raises the likelihood of hyperinflation in which runaway prices destroys the value of its currency. Like the climate, the financial markets are warming.
Ironically America, the largest debtor in the world with its growing deficits is dependant on China’s capital. In becoming America’s largest creditor, the dollar’s reserve role is thus dependent on China not dumping dollar denominated bonds and dollars. As tensions escalate, we believe gold will be a good thing to have should the rivalry between US and China turn into a capital war. For thousands of years, gold was hedge against inflation and today, gold is set to become the 21st century’s preeminent safe asset.
Recommendations
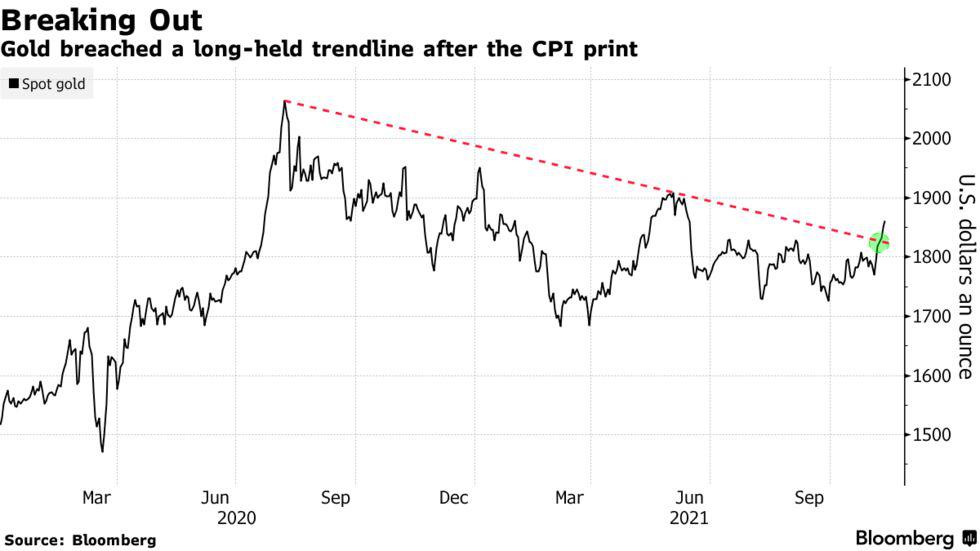
There are fears that rising interest rates are negative for gold. Rising interest rates are a function of rising inflation pushing borrowing costs deeper into negative territory helping to finance big debts. And like the Seventies when the rates were negative led by the Swiss, inflation was the worst in modern times and rising rates back then was accompanied by an explosion in the price of gold peaking at $850 an ounce. During the Eighties, rates turned positive. Today, despite an uptick in rates, the world’s negative yield debt has hit a record $17 trillion as rising inflation pushes real interest rates to 1970s lows. Almost a quarter of investment grade debt currently carry a negative yield, which means investors are losing money everyday. As in the Seventies, negative yields are good for gold and we continue to expect $2,200 an ounce price for gold.
Gold bullion finally broke out from its trading range between $1,750 and $1,800 an ounce. We believe that climate change, a weakening US dollar, record government IOUs, geopolitical tensions and the political stalemate in Washington are but a few potential catalysts. The world has too many dollars, whether they want to or not. What damages trust in the US, damages the world. Investors are left wondering whom or what they can trust. Despite fears of tightening, the Fed continues to provide an easy money environment, emitting greenbacks by the trillions. Technically, gold has broken through its short term 40-day moving average, 15-day moving averages and 65-week long-term moving average. Bollinger bands too have flattened. That is good for gold, but bad for the dollar.
We continue to believe the gold miners will outperform bullion. Gold miners had a solid quarter but inflation has hurt margins. Selectivity will be particularly important. Balance sheets are strong after an era of capital discipline. We continue to recommend big cap Barrick Gold. B2Gold and much enlarged Agnico-Eagle. Both Alamos and Newmont had disappointing quarters because of unexpected production shortfalls. Mid cap players such as Eldorado and Centamin are expected to be part of the continuing consolidation process. Higher cost producers like New Gold, Yamana and IAMGold remain workout situations needing time and capital. On the other hand, developers with feasibility studies, like McEwen Gold, Kinross and Dundee are favoured in the current cycle.
Agnico’s merger of equals with Kirkland Lake Gold capped an active period of mergers and acquisitions. The consolidation is in reaction to the lack of overall funding following the absence of traditional players who once financed this space. Second, the emergence of Exchange Traded Funds (ETFs) as a simpler investing vehicle than buying and risking a bet on a single player has resulted in a trend to multi-mine and larger cap entities. Also, with the industry suffering from depleting reserves, deals like Kirkland’s acquisition of Detour provided a long life for short-life Kirkland Lake, supporting its premium valuation. That move paved the way for Agnico’s opportunistic purchase of Kirkland.
Consequently, with excess cash flow and wider margins together with the absence of “game changing” tier 1 targets, the industry has instead boosted dividends, buybacks and increased exploration budgets. However, unlike previous periods when companies went to explore parts unknown, organic growth and acquisitions close to operations has become common. Endeavours acquisition of Teranga is a good example. Barrick’s sojourn into Red Lake is another. Or, Newcrest’s premium $3.5 billion bid for Pretium in B.C.
China is the world’s largest producer in the world, as well as the world’s largest consumer of gold. Yet China’s mines have relatively short mine lives and reserves. China is now the sixth largest holder of gold with $1 trillion of its foreign exchange reserves in US debt. China’s gold market has grown with the Shanghai Gold Exchange (SGE), the world’s largest exchange for trading physical gold. Still, China remains a net importer of gold. As part of the internationalisation of the renminbi, we expect gold to have an increasing role. The digitalisation of the renminbi is a first step. Another step we believe is for Chinese companies to buy up international reserves. Barrick, has joint ventures with Zijin and Shandong Gold Group. Chifeng Jilong Gold has made a bid for Golden Star for $470 million for the Wassa, an underground mine in Ghana, West Africa. We expect China’s big gold companies to continue to branch out overseas, adding to the buying fever. Like a game of musical chairs, with gold miners buying each other and the potential spate of Chinese buyers, there won’t be many chairs left for investors.
This bull market has just begun.
Agnico-Eagle Ltd.
Canadian miner Agnico reported third quarter income of $114 million and a nine month net income of $440 million on record production of 520,000 ounces with a big contribution from LaRonde, Goldex and Canadian Malartic, benefiting from automation measures. Guidance was unchanged at 2 million ounces. Agnico plans to spend a record $160 million on exploration this year. The combination with Kirkland Lake Gold is a brilliant acquisition with a reserve and resource base of 70 million ounces, combined production of 3.4 million ounces a year and the best collection of complementary assets in Ontario and Quebec mining districts. For example, Agnico’s Upper Beaver is only 19 kilometres from Kirkland’s Macassa mill, where both management have expertise. We like the shares here.
Barrick Gold Corp.
The world’s second largest miner, Barrick is busy funding exploration plays from Red Lake to BC to Guyana to Egypt, after concluding there were few transformative acquisitions ahead. Growth will come from organic growth, the drill bit and extracting value from Barrick’s Tier 1 core assets. In particular there is Nevada Gold Mines where there is exploration upside now that the district is under one umbrella. Older projects like Pascua Lama and Donlin are getting another look and Barrick continues to admit they are underinvested in Canada, thus the emphasis on Hemlo and Donlin. Production is on target with the last quarter expected to be stronger because of mine sequencing and an uptick in production from the Nevada gold mines and Bulyanhulu. Meantime construction on the Pueblo Vieja joint venture in the Dominican Republic has started and will be completed by the end of 2022. With over 90 million ounces of reserves in the ground in safe geographic jurisdictions, we continue recommend the shares here.
B2Gold Corp.
Earnings were in line with expectations with production of 310,000 ounces at AISC of $800 an ounce. Masbate in the Philippines had a better quarter due to higher grades from the main Vein Pit. Flagship Fekola produced 166,000 ounces which will boost guidance. B2Gold will be shipping ore from nearby satellite deposit Cardinal to the Fekola mill under the same mining permit. Work on joint venture Gramalote continues as they rework the feasibility study metrics with an update expected in mid-2022. At Burkina Faso, B2Gold sold its 81 percent interest in the Kiaka project for shares and cash and will spend $65 million on exploration. With three operating gold mines, B2Gold is one of the lowest cost gold producers with AISC less than $800 an ounce, B2Gold has almost $190 million free cash flow and its balance sheet is strong with $546 million in the bank. We like the shares here.
Centerra Gold
Intermediate producer Centerra reported gold output of 77,000 ounces which was the first quarter without Kumtor Mine which was expropriated by the Kyrgyz Republic. The remaining Mt. Milligan in BC and Oksut mine in Turkey had a decent quarter. Centerra reported free cash flow of $41 million adding to an already healthy debt-free balance sheet with cash of $912 million and AISC at $781 an ounce. Centerra should produce 310,000 ounces this year and Mt. Milligan’s water problems seem to be behind them. Still, with its major asset gone and the likelihood of protracted litigation, the shares are dead money.
Eldorado Gold Corp.
Mid-tier Eldorado reported a good third quarter, increasing guidance for the year to 460,000-480,000 ounces of gold with an AISC of $1,000 an ounce from four mines. Free cash flow was $30 million with $18 million spent at Kisladag. Next year the HPGR at Kisladag will make a full year contribution. In Greece, Skouries received approval for dry stack tailings but Eldorado shutdown Stratoni, which was losing money and lacks reserves. In the quarter, Eldorado had cash and equivalents of $439 million and a $250 million undrawn facility. The company’s Sigma work remains on schedule to be completed by yearend, allowing efficiencies and access to more ore like Ormaque. The Street is paying little for Eldorado’s Greek Kassandra assets so there are potential upside surprises. We like Eldorado here.
IAMGold Corp.
IAMGold is embroiled in security issues at its flagship Essakane in Burkina Faso after a second ambush reflected the growing violence at the West African mine. Also, IAMGold’s 70 percent owned Côté Gold mine capex increased 28 percent and the project is only 36 percent complete. Somewhere between with $860 million and $900 million needs to be spent. Capex at Côté this year is expected at $350 million of which $200 million has been spent. At $1,600 gold, Côté IRR is a dismal 19 percent so we think the project is a difficult one. IAMGold seems to be hit with higher costs everywhere with AISC at a whopping $1,500 an ounce due to continuing problems at Westwood, Saramacca and Rosebel. At Rosebel they admitted they are working on a new geological model suggesting that there are more surprises ahead, including the likelihood of a downgrade in reserves and thus mine life. We think the shares should be sold as the Company managing to lose money while gold is above $1,700 an ounce at a time when its peers are rolling in cash. Sell.
Newmont Corporation
Newmont shocked the street by reducing production guidance for this year and reported increased costs due to inflation. Newmont produced 1.4 million ounces of gold. The miner did generate cash flow of $1.1 billion and free cash flow of $735 million. Capex was almost $400 million. The main problem was the introduction of the world’s first autonomous haulage fleet at Boddington in Australia. Wet weather and teething problems caused disruptions resulting in lower tonnage and production shortfalls. The system was to be the only one and might remain so. Meantime Newmont continues to restructure the former Goldcorp portfolio and work out problems at Eleonore, Musselwhite and Porcupine. Newmont is a cash machine with $7.6 billion in total liquidity as well as a generous dividend policy. Nonetheless, we prefer Barrick with fewer problems, superior growth and superior execution capabilities.
Yamana Gold Inc.
Yamana produced 226,000 ounces in line with estimates. El Penon in Chile continues to perform well while Cerro Moro had a better quarter. Flagship Jacobina had a strong quarter and the Phase 2 expansion will be an important contributor. Jacobina has so far produced 2 million ounces and the expansion lengthens that mine’s life. Importantly, Yamana’s free cash flow was $82 million needed as the company reduces its $750 million debt load incurred to buy joint venture Canadian Malartic. Given the debt load, we prefer B2Gold here for superior growth and a better balance sheet.
John. R. Ing
Please refer to the Legal Section of our website (maisonplacements.com) for our Research Disclosures for an explanation of our rating structure at https://maisonplacements.com/research-reports.
********
More from Gold-Eagle


