Gold Market Continues Sideways; Value Lies in Gold Stocks for Now
The gold market continued its long, arduous sideways trend in the remaining weeks of 1998 and in the first two weeks of 1999. In the last one year absolutely nothing has changed as gold moves within a narrow trading range between $285-$300/oz.
The big question, of course, that every gold investors wants to know is, "does this trading range represent accumulation or distribution?" The simple answer to that question is, "nobody knows and nobody will know until gold breaks decisively out of that range in one direction or another." This is perhaps one of the most basic and profitable rules of trading/ investing we can think of. When the price of any given security is trading in a narrow range bounded by clearly defined support and resistance lines (i.e., trading channel), one must never make the mistake of presuming to know which direction prices will head upon breaking out of the channel.
In the past several weeks of sitting in frustration waiting for gold to do something, we were eased by a re-reading of that marvelous book, Reminiscences of a Stock Operator, which every trader should have in his or her library. The book's main character, Larry Livingston (a fictionalized version of legendary trader Jesse Livermore) recounts his experiences trading stocks and commodities over many years. As a tape reader, Livingston traded securities only from a technical standpoint, much the same way we do. He recounts an experience that is analogous to today's range-bound gold market: "In a narrow market, when prices are not getting anywhere to speak of but move within a narrow range, there is no sense in trying to anticipate what the next big movement is going to be—up or down. The thing to do is to watch the market, read the tape [i.e., use technical analysis] to determine the limits of the get-nowhere prices, and make up your mind that you will not take an interest until the price breaks through the limit in either direction."
In gold's case, we must await a decisive break above $301/oz. resistance by at least 3% (the standard Edwards & Magee breakout rule) before committing heavily to long positions in the market. A 3% break below $285/oz. support will likewise signal an Edwards & Magee sell signal where we can profit from a price decline and accumulate the metal at much lower levels. Until then, investors should make no firm commitments either way.
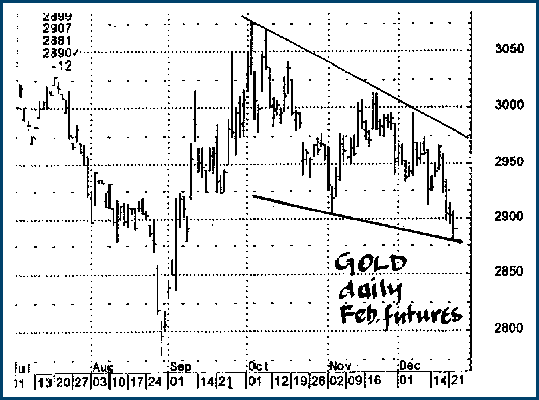
For those who are bullish gold, however, there is one positive technical development on the chart. A scan of the daily bar chart for February gold futures shows the formation of a bullish pennant, which points toward a move upward to at least the $300-$305/oz. resistance area in the very near future. Will this prove to be the move that catapults gold into even higher levels? We'll just have to wait and see.

Meanwhile, the gold stock outlook hasn't been this rosy in quite some time. You almost can't go wrong in committing to gold mining shares right now, and our recent Canadian gold stock picks have been performing nicely. There is still much value in the gold shares sector, and in our opinion Canadian golds offer the single best value and profit opportunity in the entire overvalued North American equities market.
Canadian gold stocks (most of which trade on the Toronto Stock Exchange) worth taking a look at include: Jordex Resources, which shows a high volume accumulation pattern developing on its chart after several years of declining prices on low volume. This could well represent the start of a new up move. MacMillan Gold has put in a nice-looking head and shoulders bottom pattern and is now heading up. A small bullish flag has also appeared on its chart, pointing to even higher prices ahead. Another mining stock that looks to be putting in a bottom is Kinross Gold Corp., which has apparently been in an accumulation pattern for most of '97 and '98. An upmove could begin at any time.
A slightly riskier play on a very "cheap" gold stock can be found in Montello Resources, which has found a strong bottom at around $0.20/share. It has had trouble sustaining an upward move in the past year, but its chart is starting to look bullish again. A speculator's play. N.A. Palladium has found a strong bottom at $1/share and is apparently being accumulated in anticipation of another bull move. Another speculative but worthwhile play.
The TSE Gold & Precious Minterals Index itself is looking bullish, with a bullish flag forming on its weekly bar chart and prices trading above its 10- and 30-week moving averages. And of course, the XAU is looking better than it has in months and has registered an all-clear bullish signal. An apparent intermediate head and shoulders bottom has been established with the head at the $48 level and the neckline near the $80 mark. This would point to a minimum upside target of approximately $112 in the XAU (using the Edwards & Magee measuring formula) if indeed the head and shoulders reversal is valid.
In sum, the North American gold market outlook offers many wonderful values and opportunities in the weeks and months ahead. The physical bullion market itself is still in an iffy position but anything can happen. Whatever develops, be prepared to take advantage of it.


