Gold Market Update
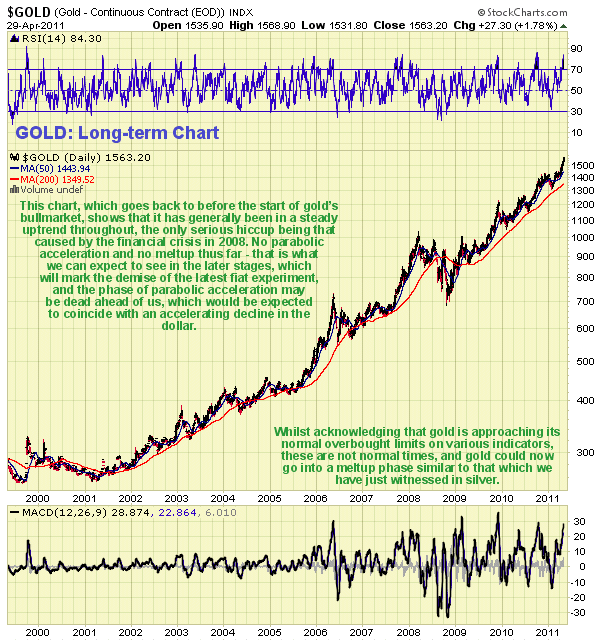
The interesting thing about gold is that although it has been in a steady long-term uptrend there has still been no meltup, such as we have seen in silver, but if the dollar really caves in that could very well happen - and such a meltup may have just started this past Friday.
The most important thing revealed by our long-term chart for gold, which goes back to the beginning of its bullmarket, is that its uptrend to date has been steady - there has been no parabolic blowoff move, and certainly no meltup - that is believed to lie ahead of us and it will mark the final climactic phase of this bullmarket that will lead to the latest fiat experiment being consigned to the trashcan of history. If it is just starting now we could see some real fireworks shortly, but as stated in the Silver Market update, you should be careful what you wish for, because such a meltup would be expected to synchronize with an all-out dollar collapse, which the Fed and Wall St banks have worked tirelessly for years to bring about - the Fed has in fact now painted itself into a corner, which is why it cannot follow suit when the European central banks raise rates to head off inflation - it CANNOT raise rates, because if it did it would collapse the debt-wracked US economy and and bring the major Wall St banks' derivatives pyramid crashing down. So it has decided on procrastination and what for it and its cohorts in kleptocracy is the best option, which is to allow the dollar to go down like a lead balloon, which at least serves the purpose of defrauding foreign creditors out of fair value for their holdings of dollar denominated securities, especially Treasuries.
So it was very interesting to see gold finally follow silver's lead by zooming ahead on Friday, as we can see on our 6-month chart, and while it is possible that both it and silver are putting in an intemediate top, especially with gold now being very overbought on a short and medium-term basis, the latest COT chart for silver, which is strongly bullish despite silver being fantastically overbought, suggests a continuation of the meltup in silver and thus a possible meltup phase for gold, which could lead to its exceeding our $1700 target zone by a country mile.
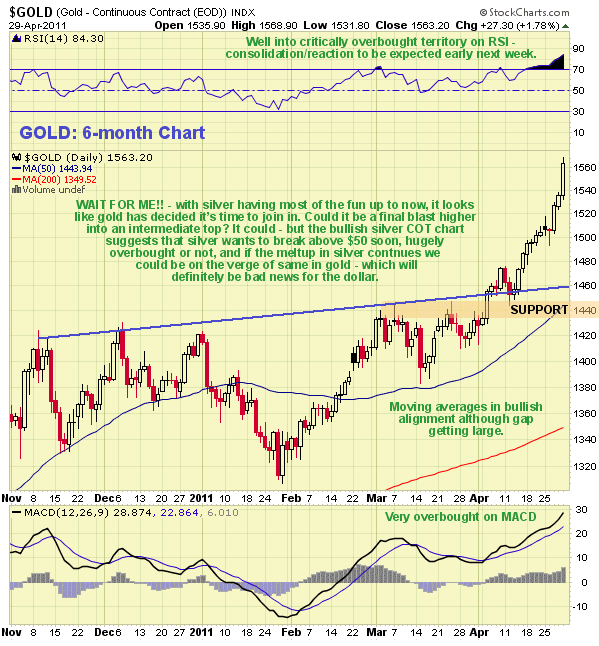
With gold well into critically overbought territory on its RSI indicator it is reasonable for it to take a breather early next week to digest its latest gains and we can expect that. Then we will watch to see if silver can vault above its key $50 rersistance level, which will have major implications for gold (and the dollar).
The big question on the minds of silver investors and especially silver traders is whether the meltup in silver has run its course, or whether it has further to go. On Monday last week we saw temporary burnout with a Reversal Day showing up on the chart at a point where silver was fantastically overbought. On the basis of this, and also the extremely bullish public opinion on silver and extremely bearish public opinion on the dollar (the public are normally wrong) it was reasonable to conclude that silver had either topped out or that a correction was imminent, and that is what we did conclude. However, the situation is now complicated by the fact that the latest COT figures reveal that Commercial short and Large Spec long positions have been dramatically scaled back just over the past week, which is not what you would expect to see ahead of a drop - what should happen is that Commercial short positions either ramp up or least remain constant. This latest COT chart by itself portends another upleg soon. To make life even more interesting we had a bizarre divergence between the performance of gold and silver on Friday, with gold soaring and silver reacting back by about 50 cents. Even though they theoretically shouldn't, gold and silver normally move as if joined at the hip in their day to day fluctuations, so this huge divergence was most unusual. What can we put it down to? - well, silver has stalled out at its 1980 highs, and even though the 1980 highs are 31 years ago so we wouldn't expect much resistance at this level as very few will have held on for all those years, it is still a psychologically important level because a break above it means silver attaining new all time highs, and these highs happen to coincide with major "round number" resistance at the $50 level. Therefore, if silver gets above this level we can expect the meltup to accelerate even more, and the COT chart does suggest that this level will soon fall. This is why silver held back on Friday even as gold advanced strongly - the $50 level is hugely important.
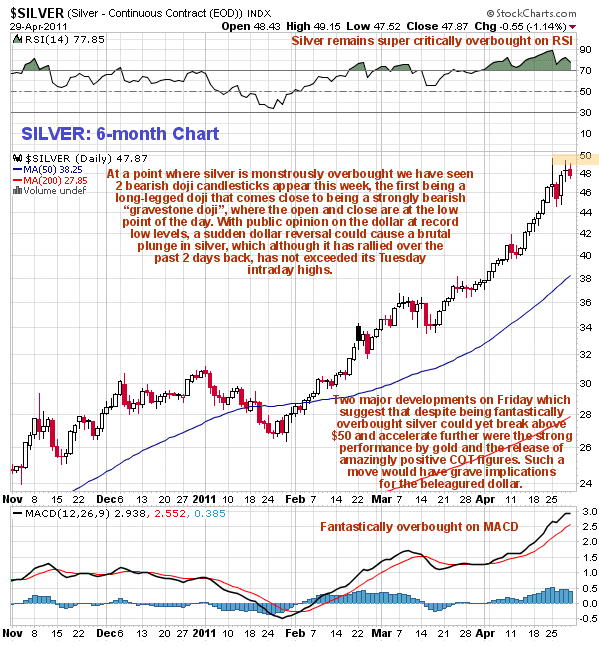
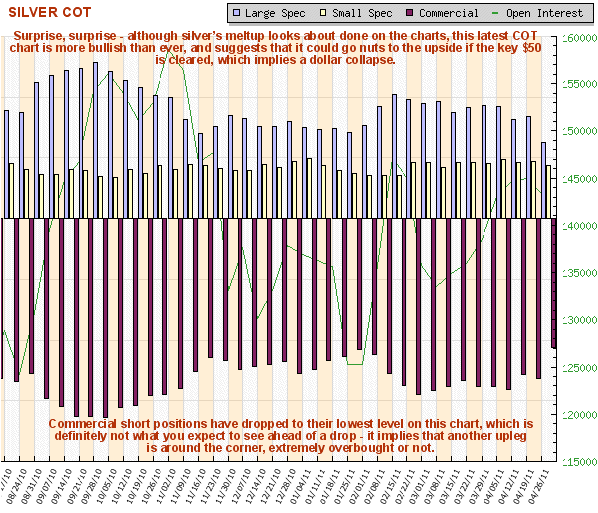
To say that silver's uptrend looks unsustainable on its long-term charts would rank as one of the understatements of the year, given how incredibly overbought it is on its MACD indicator, yet, as we have observed the latest COT chart does suggest another upleg. You have all heard the saying "Be careful what you wish for - (because you might not like the consequences if it comes true), and that is certainly the case here, for if silver's meltup continues, and gold moves into meltup mode too, which may have just started on Friday, then it probably means a collapse in the dollar - not a drop, a COLLAPSE, that will have disastrous consequences for the US economy and way of life as a result of inflation ramping up in the direction of hyperinflation, which will collapse living standards in the US and destroy the middle class (what's left of it), most of whom will suddenly find gas unaffordable and food very costly. It will be back to commuting to work on a bus, if you are lucky enough to have a job, that is, and if you happen to live near a bus route. Look on the bright side, it will at least help to conserve the world's oil supplies.
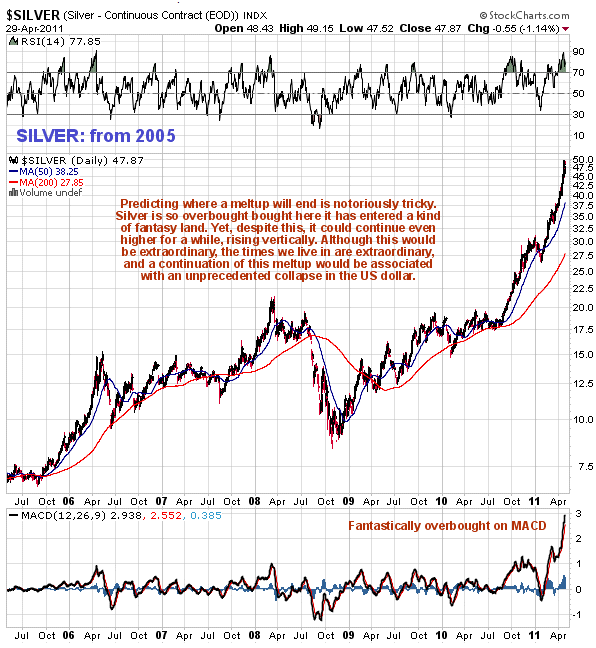
Obviously, if you are long silver or silver stocks, you will want to milk the meltup for all it's worth - after all, it would be a shame to sell now and then have silver tack another say $30 in a matter of just weeks. But at the same time, you don't want to be around if the wheel suddenly comes off, especially given that when silver drops it drops like a rock. The way to handle this? - simple - stay long and buy yourself cheap protection in the form of out-of-the-money Put options in silver itself, or Call options in something like the ProShares Ultrashort Silver, code ZSL. The cost of these options is peanuts compared to what you will save yourself if silver should suddenly tank.
Clive Maund, Diploma Technical Analysis
[email protected]
www.clivemaund.com
Copiapo, Chile, 1 May 2011


