Gold Market Update


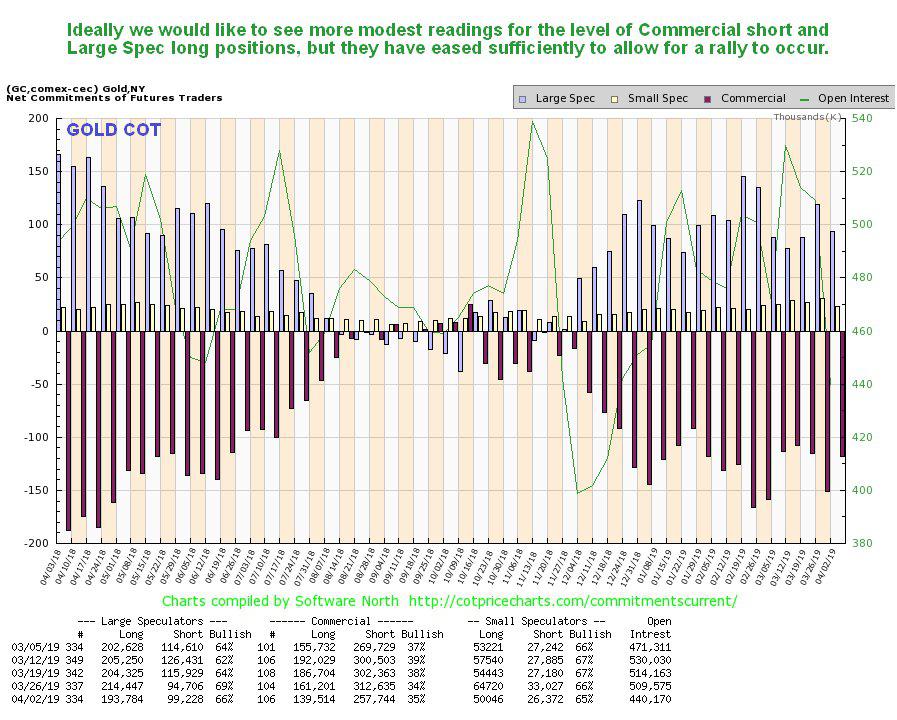
I was in receipt of the following erudite communication about Commercial gold short positions yesterday from a friend in Toronto…
“Re: HOLY SHISA BATMAN: THE COMMERCIALS COVERED OVER 70 000 Gold Short Contracts!!!!!!!!!!!!!!!!!!!!!!!! – Can you say WOW!!!!!!!!!!”
…and while I myself would perhaps have expressed this in a somewhat more restrained manner, the point is certainly worth taking, especially as there were two other developments during last week that were positive for both gold and silver, as we observed yesterday in the new Silver Market update. These were a run of bullish candlesticks on both the gold and silver charts last week and then we had Trump declaring after Friday’s close that the Fed should revert to QE again, meaning QE4. If they take him at his word the dollar is going to suffer terribly this time round which will ramp up inflation – good news for gold and silver.
So, despite gold looking like it is completing a Head-and-Shoulders top on its 8-month chart, as we will see below, it now looks like this pattern will abort and gold will soon reverse off support at the bottom of it into a new uptrend. This means that the short-term bearish scenario set out in Gold And Silver Interim Updates is now unlikely to become reality and the scenario set out in last full Gold Market update is back on track.
We’ll start our review of the charts with a look at the latest 1-month chart for gold, which shows to advantage the bullish looking candlesticks late last week at support at the lower boundary of the potential Head-and-Shoulders top. As we can see a couple of long-legged or “dragonfly” dojis appeared on the chart on Thursday and Friday. These dojis are a sign of indecision which coming after a drop frequently precedes a rally, especially as the long lower shadows are a sign of buyers snapping at silver on dips. Action in silver last week looked more bullish still as a run of dojis occurred all week on its chart, but then silver is on a stronger support level than gold is.

The 8-month chart for gold still looks quite worrying with an obvious potential Head-and-Shoulders top completing and quite high downside volume recently, and it could yet break lower, which COTs show is still possible, despite the big drop in Commercials short positions. However, Trump’s remarks on Friday could tip the scales by causing the dollar to drop.
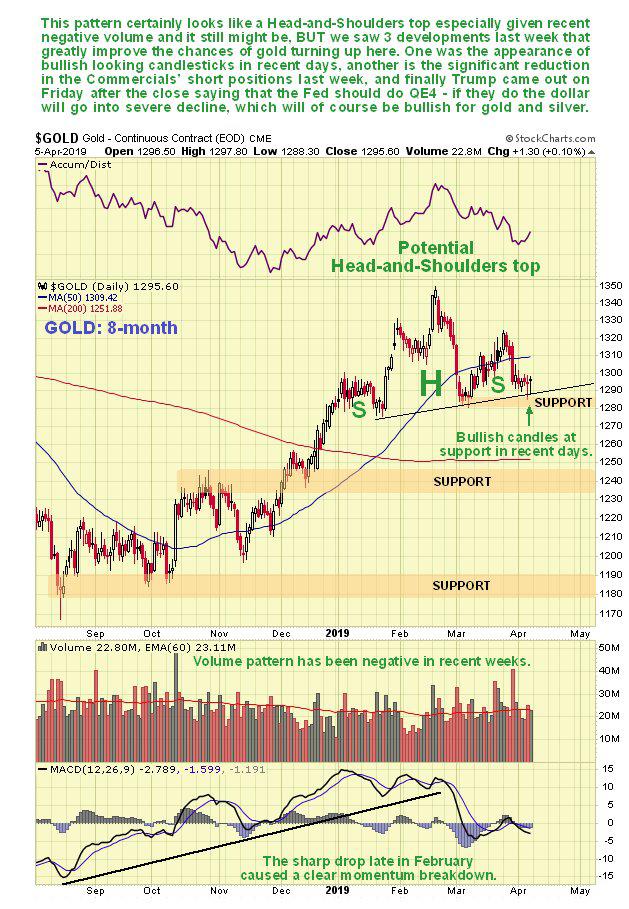
This is a good point to veer off and take a look at the latest COT chart for gold on which we see that while Commercial short and Large Spec long positions did indeed ease last week, enough to permit a rally, they are still at fairly high levels, which is why we cannot entirely rule out a further drop, although as mentioned above, other factor are pointing to an imminent rally.
Click on chart to popup a larger, clearer version.
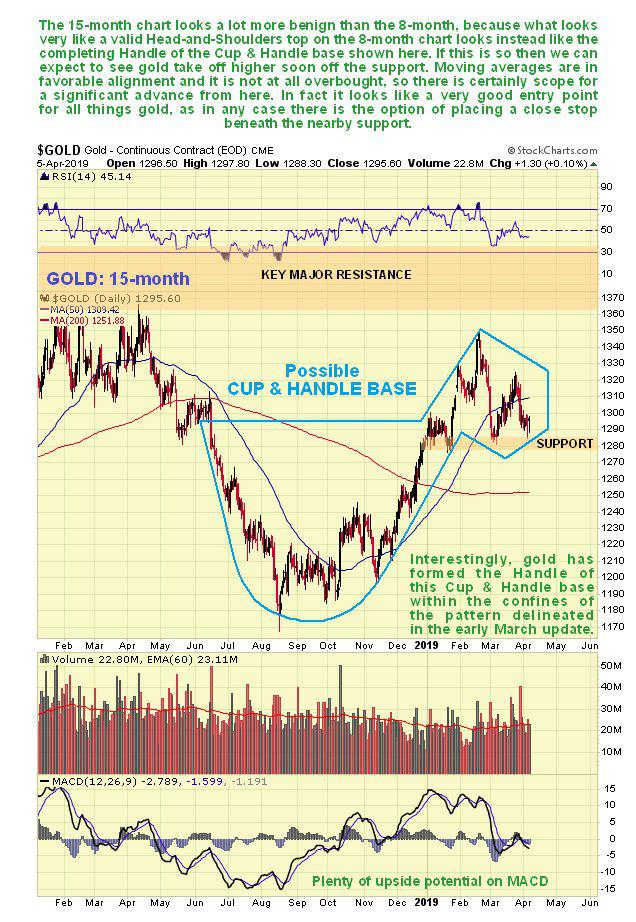
The 15-month chart is much more encouraging as what looks like a completing Head-and-Shoulders top on the 8-month chart looks instead like the completing Handle of a large Cup & Handle base on this chart. If so then we can expect gold to take off higher soon from the support, which is made more possible by moving averages being in bullish alignment and gold not being at all overbought on its MACD indicator.
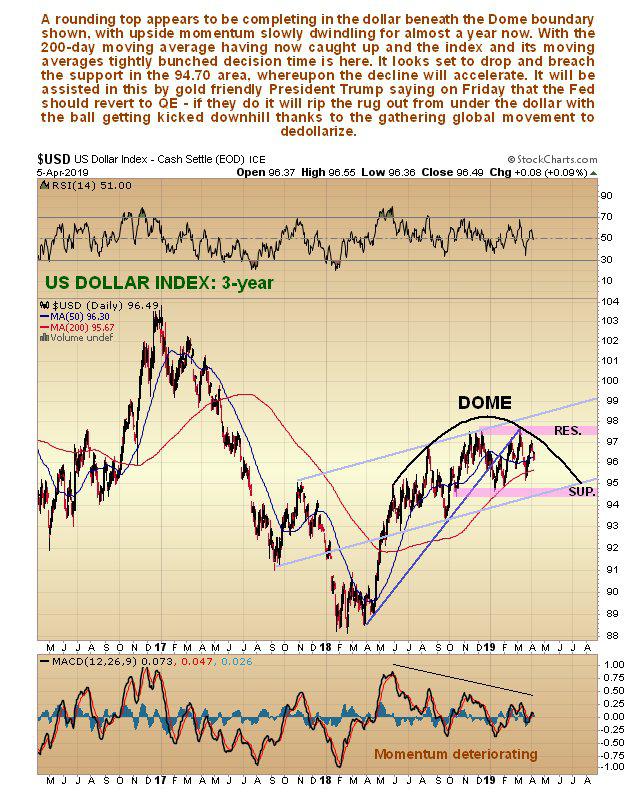
So you see that gold’s next move is quite heavily camouflaged, although, as already mentioned, inadvertent gold friend Donald Trump may have just tipped the scales in gold’s favor, by signaling to the Fed that he wants them to revert to QE, although that by itself doesn’t mean that they will do what he wants, but if they do the dollar will tank and right now it’s starting to look rather frail on the charts…
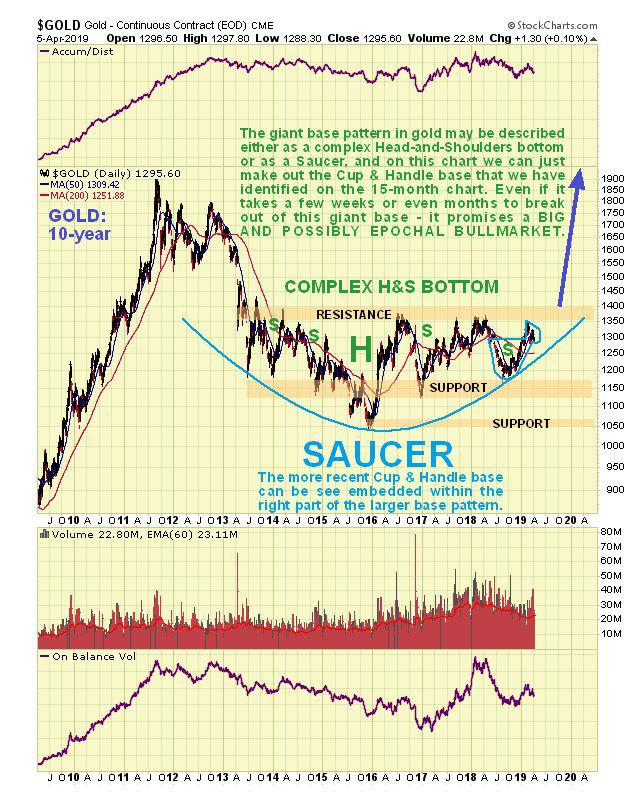
Finally, on its long-term 10-year chart we can see that gold is still on track to break out from its giant Saucer base before much longer, which will be achieved by its breaking clear above the strong resistance at the top of it, approaching and at the $1400 level, and here we should note that gold has already broken out against the Australian dollar, which partly explains some big gains in Australian gold stocks, and looks set to break out soon against the Swiss Franc. There are several other observations to make regarding where gold is at within this important Saucer pattern against the US dollar. The first is that a base pattern of this magnitude, which has been forming for 6 years now, and is relatively symmetrical, is unlikely to lead to a failure or breakdown. The second is that the rising Saucer boundary is now coming into play and should force an upside by the end of the year at the latest – more likely is that gold breaks out during its seasonally strong months of August and September. The third point is that when it does break out it will be A MAJOR TECHNICAL EVENT THAT WILL USHER IN A BULLMARKET THAT WILL DWARF ANY EARLIER ONE which is hardly surprising as it will be against the background of hyperinflation caused by unrestrained QE.
*********

Clive P. Maund’s interest in markets started when, as an aimless youth searching for direction in his mid-20’s, he inherited some money. Unfortunately it was not enough to live a utopian lifestyle as a playboy or retire very young. Therefore on the advice of his brother, he bought a load of British Petroleum stock, which promptly went up 20% in the space of a few weeks. Clive sold them at the top…which really fired his imagination. The prospect of being able to buy securities and sell them later at a higher price, and make money for doing little or no work was most attractive – and so the quest began, especially as he had been further stoked up by watching from the sidelines with a mixture of fascination and envy as fortunes were made in the roaring gold and silver bull market of the late 70’s.
Clive furthered his education in Technical Analysis or charting by ordering various good books from the US and by applying what he learned at work on an everyday basis. He also obtained the UK Society of Technical Analysts’ Diploma.
The years following 2005 saw the boom phase of the Gold and Silver bull market, until they peaked in late 2011. While there is ongoing debate about whether that was the final high, it is not believed to be because of the continuing global debasement of fiat currency. The bear market since 2011 is viewed as being very similar to the 2-year reaction in the mid-70’s, which was preceded by a powerful advance and was followed by a gigantic parabolic price ramp. Moreover, Precious Metals should come back into their own when the various asset bubbles elsewhere burst, which looks set to happen anytime soon.
Visit Clive at his website: CliveMaund.com


