Gold Market Update


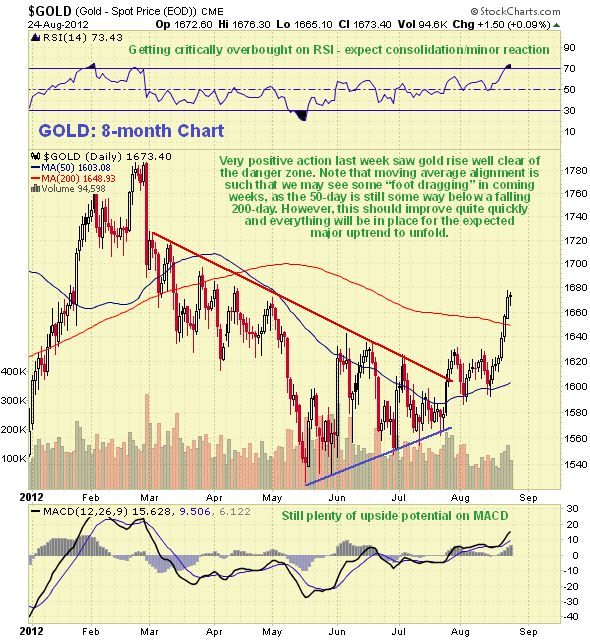
Last week we got what we had expected - and prepared for - for weeks, an upside resolution of the tight standoff in both gold and silver. Actually, gold signalled that it was going to go up several weeks back, when it broke out of the Triangle shown on its 8-month chart below, in late July. The breakout from the Triangle was on good volume, and it then consolidated in a nice tight Pennant pattern before breaking higher to run ahead sharply last week. So is that it - are we on our way now? - almost, but there is one remaining major hurdle left to clear. Before going on to consider what that is we should take note of the fact that gold is now short-term overbought as shown by its RSI indicator, which is entering critically overbought territory, and it has also punched through a still falling 200-day moving average, factors which point to a high probability of it pausing to consolidate or perhaps react back somewhat in the immediate future - if it does keep going higher near-term, the advance is likely to be measured. The fact that the 50-day moving average is still some way below the falling 200-day also suggests that some more time is needed before the major uptrend expected gets into full swing.
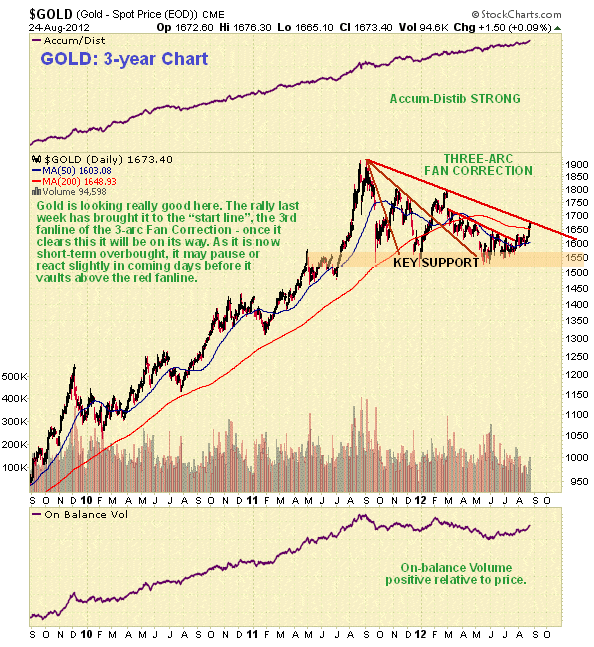
On the 3-year chart we can immediately see the one remaining hurdle left for gold to clear before it takes off strongly higher, and that is the important downtrend line in force from the highs of August - September of last year, which also happens to be the third and final fanline of the 3-arc Fan Correction that we had earlier delineated. Quite clearly a breakout above this trendline will be a major technical event - and everything is pointing to gold going on to surmount the resistance at this trendline and enter a dynamic advancing phase, including the volume indicators shown on the chart - the Accum-Distrib line is romping ahead and looks remarkably bullish.
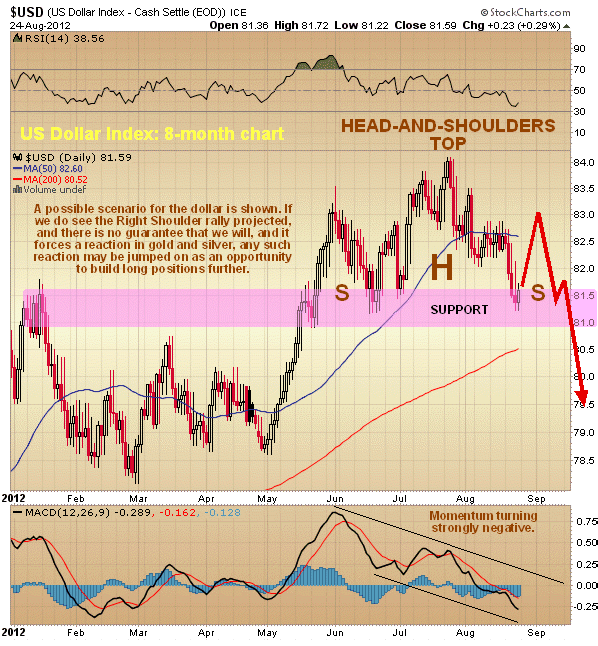
What about the dollar, whose sudden weakness last week was obviously a factor triggering the sharp rally in gold and silver? As we can see on the 8-month chart for the dollar index shown below, its drop`last week has brought it down to a clearly defined important support level, with this sharp move towards a rising 200-day moving average creating a considerable degree of "compression" that coupled with the support at the current level is likely to trigger a rebound. It looks like a Head-and-Shoulders top is forming in the dollar, so a likely scenario here is that we see a rebound short-term which takes the index back up towards the Left Shoulder high in the 83 area, and such a rebound would of course be the occasion for a reaction back in gold and silver, which should be jumped on as an opportunity to build positions further ahead of the major breakout. Here we should note that the dollar looks very weak so it might not make it as high as 83 before it turns tail and breaks down.
In conclusion, the outlook for gold is excellent at this point. It is shaping up to break out of the downtrend in force from last August - September to enter a strong uptrend that should easily take it new highs, with a brief period of consolidation/reaction expected first to unwind the short-term overbought condition arising from last week's sharp rally - and we know that our illustrious leaders, with their addiction to creating money out of thin air, stand ready to assist the continued ascent of gold.
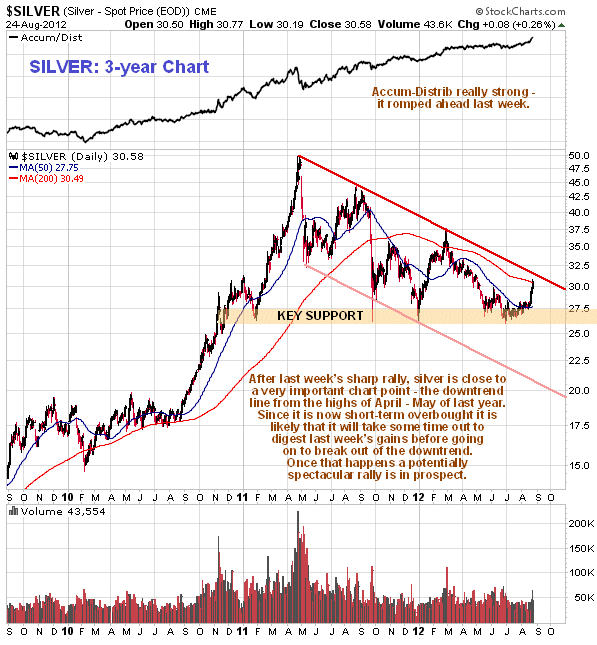
Silver Market Update
Clive Maund
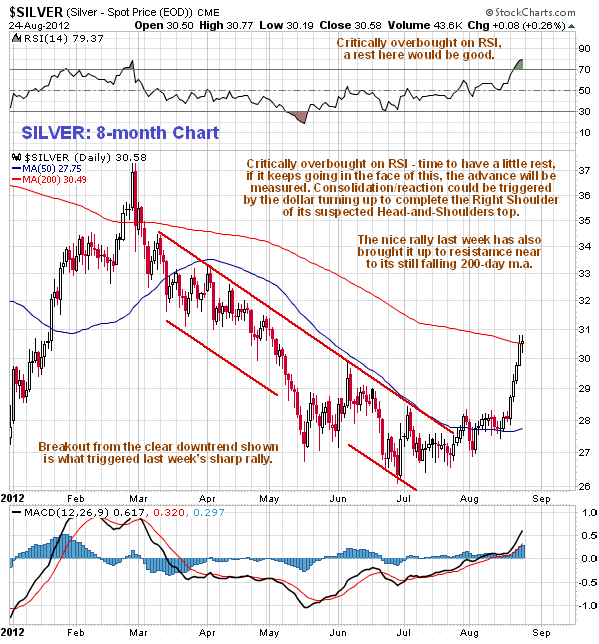
The sharp advance by silver last week was presaged by the late July breakout from the important "inner" downtrend that we had earlier delineated, which had been in force from early March, as we can see on the 8-month chart for silver shown below. So is that it - are we on our way now? - almost, but there is one remaining major hurdle left to clear. Before going on to consider what that is we should take note of the fact that silver is now critically overbought short-term overbought as shown by its RSI indicator, and it has also run into a still falling 200-day moving average, factors which point to a high probability of it pausing to consolidate or perhaps react back somewhat in the immediate future - if it does keep going higher near-term, the advance is likely to be measured. The fact that the 50-day moving average is still some way below the falling 200-day also suggests that some more time is needed before the major uptrend expected gets into full swing.
On the 3-year chart we can immediately see the one remaining major hurdle left for silver to clear before it takes off strongly higher, and that is the important downtrend line in force from the highs of April - May of last year. While it is expected to go on to vault above the resistance at this trendline before much longer, especially as we are entering the most seasonally bullish time of year for gold and silver, the current short-term overbought condition suggests that it is going to take a rest before it attempts this feat, in order for the overbought condition to unwind, and this pause is expected to synchronize with a brief dollar rebound, for reasons set out in the parallel Gold Market update. Aside from this caveat everything appears to be in place for the major uptrend expected to get underway quite soon, and it is clear that if silver does stage a clear breakout above its major downtrend line it is likely to take off like a rocket. Fundamentally, we can look to politicians to continue to play their part in the continued bullmarket in Precious Metals by continuing doing what they do best, which is to create money out of thin air, so that they can maintain their ongoing debt circus act.
Finally, I came across the following sound advice on a wall in a market in Cancun, Mexico, a few days back. For the benefit of those of you who don't understand Spanish, it reads "I buy gold and silver" - I thought "Yeah - me too!"

Clive Maund, Diploma Technical Analysis
Copiapo, Chile, 26 August 2012

Clive P. Maund’s interest in markets started when, as an aimless youth searching for direction in his mid-20’s, he inherited some money. Unfortunately it was not enough to live a utopian lifestyle as a playboy or retire very young. Therefore on the advice of his brother, he bought a load of British Petroleum stock, which promptly went up 20% in the space of a few weeks. Clive sold them at the top…which really fired his imagination. The prospect of being able to buy securities and sell them later at a higher price, and make money for doing little or no work was most attractive – and so the quest began, especially as he had been further stoked up by watching from the sidelines with a mixture of fascination and envy as fortunes were made in the roaring gold and silver bull market of the late 70’s.
Clive furthered his education in Technical Analysis or charting by ordering various good books from the US and by applying what he learned at work on an everyday basis. He also obtained the UK Society of Technical Analysts’ Diploma.
The years following 2005 saw the boom phase of the Gold and Silver bull market, until they peaked in late 2011. While there is ongoing debate about whether that was the final high, it is not believed to be because of the continuing global debasement of fiat currency. The bear market since 2011 is viewed as being very similar to the 2-year reaction in the mid-70’s, which was preceded by a powerful advance and was followed by a gigantic parabolic price ramp. Moreover, Precious Metals should come back into their own when the various asset bubbles elsewhere burst, which looks set to happen anytime soon.
Visit Clive at his website: CliveMaund.com


